
Cédric Scherer @CedScherer
🧙♂️✨📊 Independent #DataViz Consultant & Designer ♢ PhD in Computational Ecology ♢ #rstats #ggplot2 #figma ♢ #graphics #maps #ddj #design ♢ he/him cedricscherer.com Berlin, Germany Joined March 2015-
Tweets15K
-
Followers26K
-
Following2K
-
Likes26K
#30DayChartChallenge | Day 20: Correlation Catch-up contribution showing the relationship between the number of US views and the number of votes on #IMDb for 27 seasons of "The Simpsons". Special focus on call-outs and tooltip styling. #dataviz #datavisualization #datawrapper


#30DayChartChallenge | Day 22: Mobility Table of words spoken in different vehicles for transportation by land 🚗 🚌, water ⛵, air 🚁, and space 🚀 in 25 seasons of "The Simpsons". #dataviz #datavisualization #simpsons


I am still looking for speakers for Workshops for Ukraine series for summer! If you want to teach a workshop on #RStats, #Python or some other data/research related topic, DM or email [email protected]. Some potential topics in QT, but feel free to suggest other too!
I am still looking for speakers for Workshops for Ukraine series for summer! If you want to teach a workshop on #RStats, #Python or some other data/research related topic, DM or email [email protected]. Some potential topics in QT, but feel free to suggest other too!

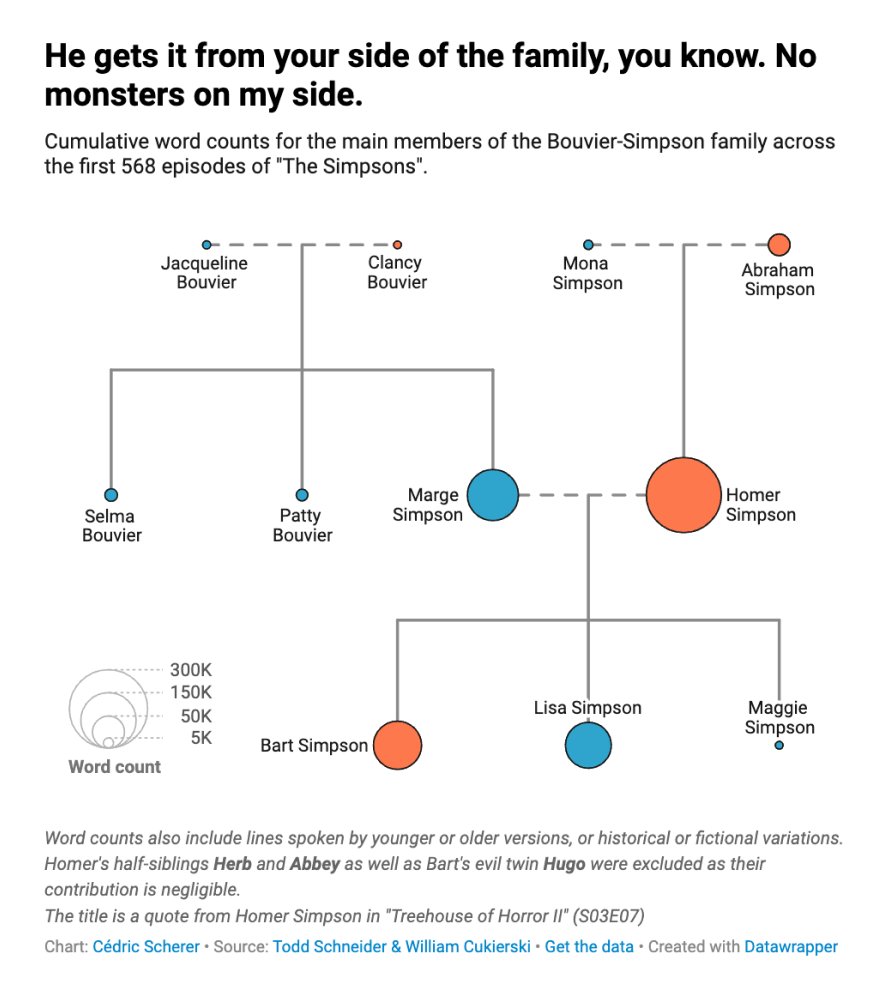
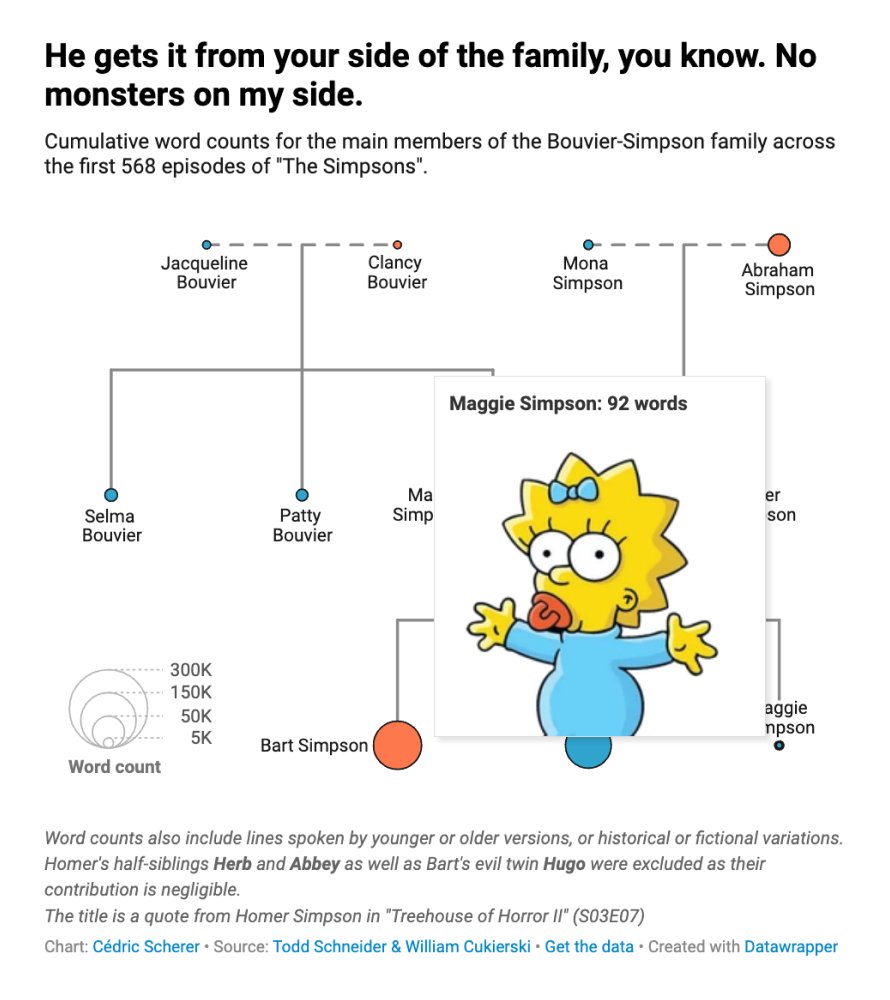
#30DayChartChallenge | Day 13: Family A family tree of "The Simpsons" with word counts for each family member, created with @Datawrapper. #dataviz #datavisualization #family #datawrapper

📊 Tutorial de ggplot2 para crear gráficos increíbles en #Rstats By @CedScherer buff.ly/3FQPqTZ #analytics #datascience #stats #data #dataviz #datavisualization #programming #code #python

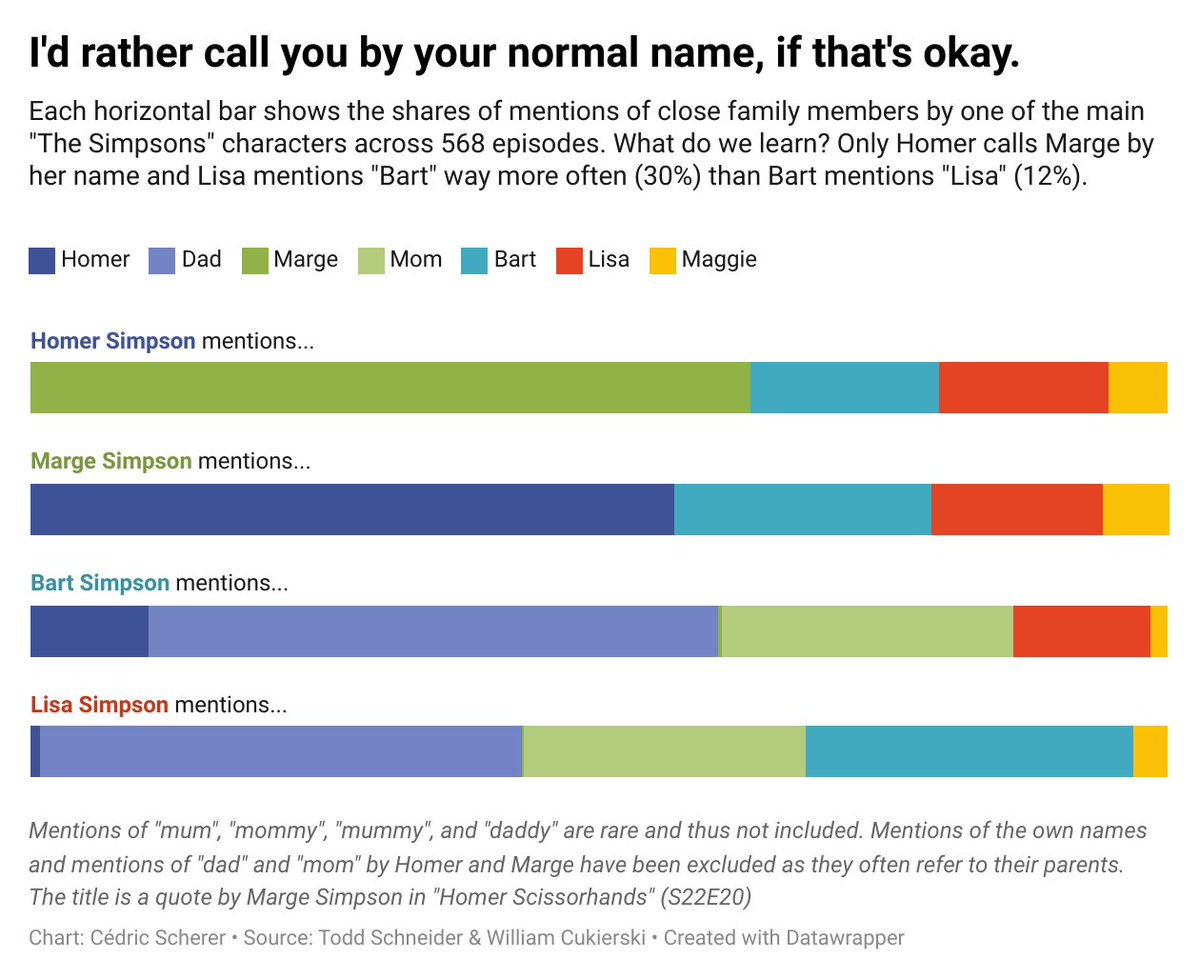
#30DayChartChallenge | Alternative Version for Day 11 A set of stacked bars for all members of the "no pie chart gang". Labels above the bars to make it work better on small screens. #dataviz #datavisualization #datawrapper #simpsons

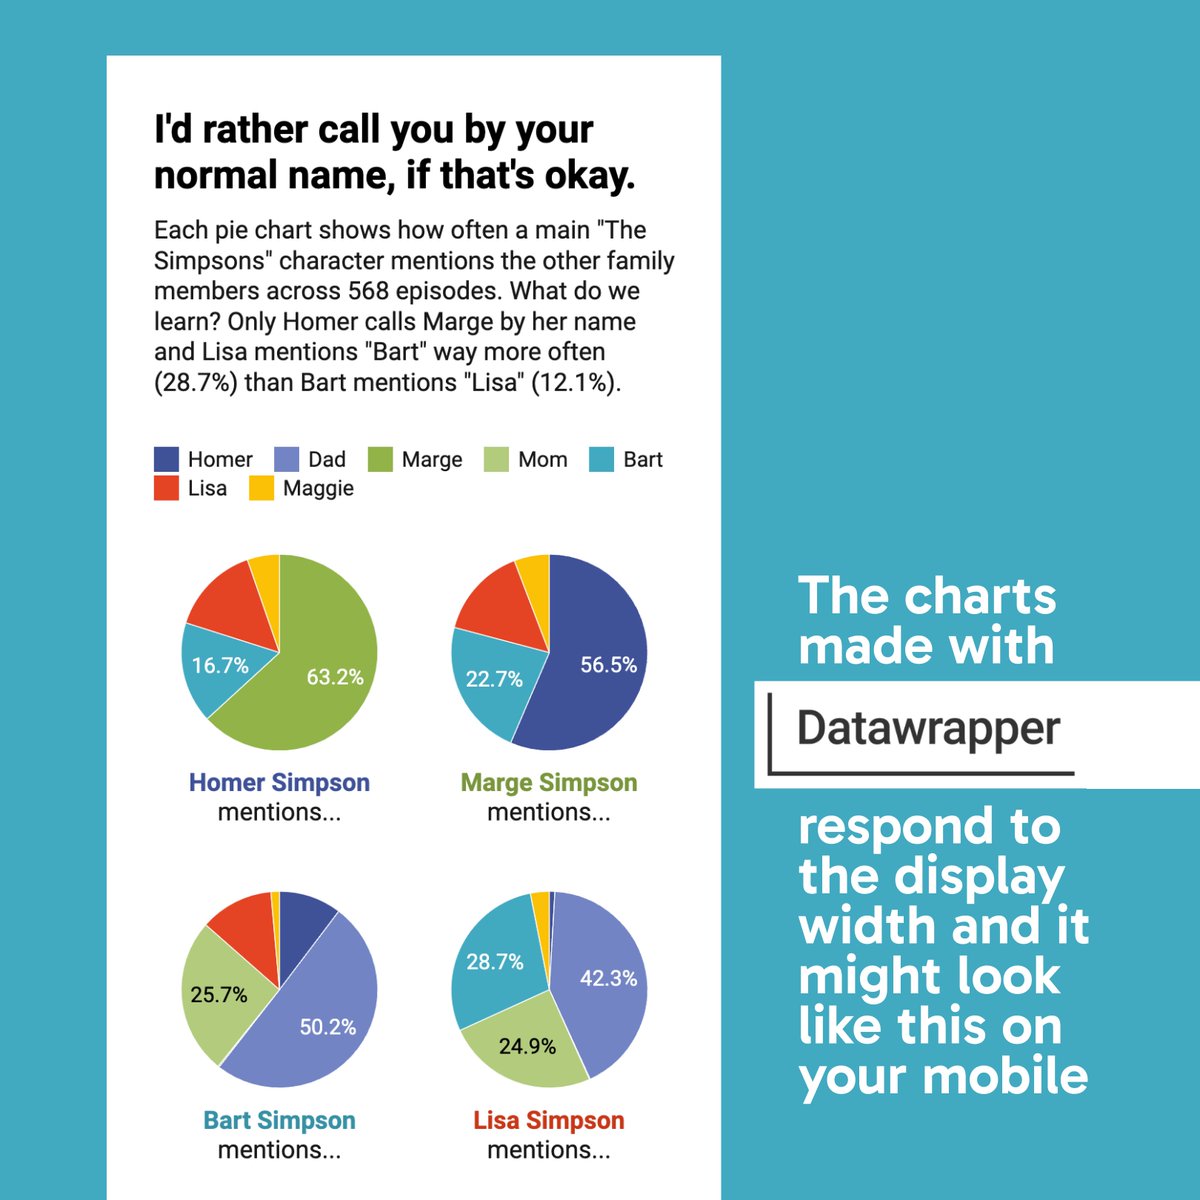
#30DayChartChallenge | Day 11: Mobile-friendly Easy peasy thanks to my tool choice! 💪 Except for the responsive resizing that @Datawrapper charts ship with, I have used a set of pie charts 🧙♀️ that realign and are thus readable even on small displays. #dataviz #simpsons


We tend to marry people around our age, which we can see through ACS data. You can see the age distribution of partners following...
I prepared a simplified version of my Bayern Munich dumbbell chart, including emphasis and a call-out, for the @R_Graph_Gallery. Thanks Yan and Joseph for sharing it as a #ggplot2 tutorial with the world 👐
I prepared a simplified version of my Bayern Munich dumbbell chart, including emphasis and a call-out, for the @R_Graph_Gallery. Thanks Yan and Joseph for sharing it as a #ggplot2 tutorial with the world 👐

#30DayChartChallenge | Day 5: Diverging 📊 Time for bar charts! Creating a butterfly chart 🦋 with #DataWrapper. If you're confused about my slightly random chart titles this year — one self-imposed rule is to use a Simpsons quote for each 🤓 #dataviz #datavis #simpsons


Albert Rapp @rappa753
13K Followers 134 Following 🎓 Math PhD student & freelancer 👨🏫 Bite-sized insights on dataviz, web dev & data science with R at https://t.co/M34b5BzHTD
R Markdown @rmarkdown
26K Followers 449 Following A community of R Markdown enthusiasts posting anything related to #RStats, especially #RMarkdown, #QuartoPub and #Bookdown.
Yan Holtz @R_Graph_Gallery
19K Followers 723 Following Software engineer who ❤️ #dataviz. Creator of https://t.co/sj29jZPkYr and the R, Python, D3 and React graph galleries. ➡️ https://t.co/PoJNeHXz8a 📈 🌊 🍺
Tom Mock @thomas_mock
19K Followers 2K Following He/Him | Product Manager @posit_pbc👨💻 I ❤️ Data, 🌮, tables, Quarto, #tidyverse & #RStats | @[email protected]
Georgios Karamanis @geokaramanis
8K Followers 266 Following Co-founder and Dataviz designer @__explained, psychiatrist, PhD student
Nadieh Bremer @NadiehBremer
48K Followers 579 Following Data Visualization Artist (+ graduated Astronomer ✨) with a love for Data & Generative Art | 🇳🇱 https://t.co/2QeuXCOGlo
Tyler Morgan-Wall @tylermorganwall
25K Followers 208 Following R, data science, dataviz, maps, raytracing. Developer of rayshader, rayrender, and the rayverse | PhD in Physics | @Penn | tylermorganwall at foss to https://t.co/pBdBFqbrE2
Nicola Rennie | @nren.. @nrennie35
5K Followers 2K Following 💼 Lecturer in Health Data Science at Lancaster University. 💻 #RStats | Python. 🎨 Data visualisation. 🏃♀️ Distance runner. She/her. Views my own.
Alberto Cairo @AlbertoCairo
68K Followers 5K Following For news, follow me on BLUESKY: https://t.co/nN8zwUEmZs and LINKEDIN: https://t.co/BV7fInzN6w
Jon Schwabish @jschwabish
24K Followers 993 Following 📈Economist & DataViz 🕸@urbaninstitute @PolicyViz 🎙PolicyViz Podcast 📺YouTube step-by-step tutorials 🗞On Substack: https://jschwabish.subst 👀All views mine
David Robinson @drob
52K Followers 650 Following Director of Data Science at @Contentsquare. #rstats fan. Dad x2. He/him
Spencer Schien @MrPecners
4K Followers 513 Following I tweet mostly about #RStats and data viz. Salesforce dev and Returned @PeaceCorps Volunteer, too. Data & Analytics for @CityForwardCol (opinions mine)
Kevin Flerlage @FlerlageKev
16K Followers 3K Following Tableau Evangelist/Data Visualization Consultant at Moxy Analytics | 5X Tableau Visionary | 5X Tableau Public Ambassador | One Half of the Flerlage Twins
Wendy Shijia @ShijiaWendy
6K Followers 2K Following Data visualization designer, Tableau Visionary & Tableau Public Ambassador
Lisa Charlotte Muth @lisacmuth
35K Followers 729 Following Formerly @lisacrost. Creating & writing about dataviz for @datawrapper. #visber & @datavisclub organizer. Also over there: @[email protected]
Emil Hvitfeldt @Emil_Hvitfeldt
7K Followers 706 Following Going dark until Twitter is a respectable place again.

David Keyes @dgkeyes
7K Followers 4K Following Helping the rest of us learn #rstats @rfortherest he/him
Cara Thompson @cararthompson
3K Followers 301 Following 👋 #Dataviz Consultant with an academic background 💙 Maximising the impact of other people's expertise
Matthias Stahl 🇪�.. @h_i_g_s_c_h
5K Followers 4K Following Husband & dad^3 ||| head of data & visualizations @derspiegel ||| #Svelte and #D3 ||| computational biology PhD ||| 🇸🇪🇩🇪🇪🇺 ||| opinions my own
Tobias Stephan @derterle
18 Followers 181 Following Pangea reunion activist ✊ | stressed and strained researcher | rock and plate tectonics DJ ...sorry for upcoming faults...
Ashok Patil @mrashokpatil
17 Followers 381 Following
Sy_dney @DneySy73663
12 Followers 328 Following

M. Ali @drmubashirali1
0 Followers 15 Following
Benny @Inomhuskille
79 Followers 850 Following

Hung Pham @hhp_9x
87 Followers 363 Following MSc biostat. A #stan stan, #rstats, randomize when you can
Yueling Peng @527874471Alex
115 Followers 571 Following PhD candidate in nephrology and bioinformatics.
Empereur des Données @EDonnees37312
15 Followers 132 Following I am here for data, mathematics, finance, and all things geeky! 2️⃣💱🧬🔭

Musa malcom @Musamalcom4441
87 Followers 3K Following Student, brother, uncle. Equal right and justice, rule of the law, separation of power, youth’s empowerment, gender equality.
Hans Peter Stüger @HansStuger
3 Followers 37 Following
Shubham Galande @GalandeSh91362
16 Followers 358 Following
Safiya Alpheus @safiya_alpheus
740 Followers 1K Following PhD Candidate in @GeoscPSU thinking hard about rivers, their bars, and all their weird shapes and forms • trinidadian • she/her • #blm

CJ Robinson @_cjrobinson
43 Followers 175 Following Analyst @ NYT Games I like cities, coffee, and transit
Maxwell George @Maxwell01491757
456 Followers 7K Following ©profile original & official ®BEST FOOTBALL BETTING TIPS AVAILABLE100% sure win matches! 100% legit sources!
JP Monteagudo 👨.. @JpPabl0
6 Followers 152 Following 📊 Aspiring data scientist🌍 Finding life and hope in data 👨👩👧👦 Christian husband and father 🙏
emel @emelref
15 Followers 414 Following
Tarun Gupta @TarunDevops
974 Followers 3K Following CTO & Founder @vivaanshtech & @Codewithtarun | 8x #Copado | 5x #Salesforce | Community Speaker & Leader #Slack,#Salesforce,#Tableau #MomentMarketers

Night Owl @raate_mogul
0 Followers 39 Following ٱرْكَبُوا۟ فِيهَا بِسْمِ ٱللَّهِ مَجْر۪ىٰهَا وَمُرْسَىٰهَآۚ إِنَّ رَبِّى لَغَفُورٌ رَّحِيمٌ
Dr. Fikho @ItsWalyne
724 Followers 4K Following BioScientist I Health Enthusiast. I talk about healthcare, supply chain and one health everything that affects wellbeing.
Dr. Ashok Patil @mrashokp
110 Followers 810 Following Ever learner, teacher, interested in physics, economics, R, and logic ...
Rinalds @RinaldGerinovic
31 Followers 447 Following
Renato Ventocilla Fra.. @RenatoVent4878
12 Followers 204 Following
@brandmen @TinnyVioli11127
74 Followers 558 Following
Nathan Sier @NathanSier
715 Followers 1K Following Washington Nationals MiLB S&C | @2SPSports | CSCS, CPSS
Joris Geertman @JorisGee
304 Followers 587 Following
Lu Nieto @AgRemotegirl
584 Followers 425 Following Agricultural Engineer, Agronomy PhD. Working with crops, remote sensing and computers. Telescopes and microscopes in my spare time.
parinaz vahabzadeh @vahabzy
462 Followers 2K Following current New Yorker. picture straightener. founding software startup.
Curiouss Coderr @CCoderr28186
5 Followers 22 Following
Rhaazor @Rhaazor
3 Followers 131 Following
Magic: The Gat 猫猫 @GatRoig
133 Followers 1K Following
@tamboduc.bsky.social @TamboDUC
2K Followers 3K Following Former Postman / Economic Historian. Andia Research Fellow @UNavarra & Researcher @LuEconHist. https://t.co/WZtlxkilNW #JackLondon and #Tolkien Fan

Janis Fiedler @FieJanis
322 Followers 364 Following PostDoc @KIT @smartfamily_kit | mHealth Behavior Change | Exercise Physiology | enthusiastic R amateur | Views are my own | @fiejanis.bsky.social
Data Wizard @DataWizardPhd
7 Followers 485 Following For the love of data, mathematics, and solving a puzzles.
Time Out @arcamachoX
280 Followers 3K Following
David Rosado @David_Rosado_R
103 Followers 646 Following Epidemiólogo, estudiante de maestría en Salud Pública (MSP - BIOSIS Virtual)
Carlos E (Cae) Louren.. @caelourenco
20 Followers 139 Following Marketing Professor @fgv_eaesp | Engagement | Research methods | Analytics | Opinions my own | ❤️ or 🔄 ≠ endorsement or supporting


Grant Huang @yanchen00
1K Followers 863 Following TW | NTU Civil eng. Student | Cartography, GIS, Transportation, Urban planning, Dataviz | In ㄎㄧㄤ we trust | DM open | Wanderlust | https://t.co/V98jUniTsh

Yam's @Yamsbindje
250 Followers 1K Following Methematicien, Patriote, Adepte a l'accès a la connaissance sans restriction Mon compte est pour jésus Soyez malins, osez douter.
Ogaal @OgaalSO
0 Followers 129 Following Fresh dose of selfless news in the spirit of the blessed revolution 🗞️ “Somalia’s paper of record” - President Siad Barre
Albert Rapp @rappa753
13K Followers 134 Following 🎓 Math PhD student & freelancer 👨🏫 Bite-sized insights on dataviz, web dev & data science with R at https://t.co/M34b5BzHTD
R Markdown @rmarkdown
26K Followers 449 Following A community of R Markdown enthusiasts posting anything related to #RStats, especially #RMarkdown, #QuartoPub and #Bookdown.
Yan Holtz @R_Graph_Gallery
19K Followers 723 Following Software engineer who ❤️ #dataviz. Creator of https://t.co/sj29jZPkYr and the R, Python, D3 and React graph galleries. ➡️ https://t.co/PoJNeHXz8a 📈 🌊 🍺
We are R-Ladies @WeAreRLadies
34K Followers 193 Following Rotating Curator for the @RLadiesGlobal community #RLadies (currently on a brief break)
Tom Mock @thomas_mock
19K Followers 2K Following He/Him | Product Manager @posit_pbc👨💻 I ❤️ Data, 🌮, tables, Quarto, #tidyverse & #RStats | @[email protected]
Georgios Karamanis @geokaramanis
8K Followers 266 Following Co-founder and Dataviz designer @__explained, psychiatrist, PhD student
Nadieh Bremer @NadiehBremer
48K Followers 579 Following Data Visualization Artist (+ graduated Astronomer ✨) with a love for Data & Generative Art | 🇳🇱 https://t.co/2QeuXCOGlo
Federica Fragapane @fedfragapane
20K Followers 1K Following Information designer based in Italy. Works in the Permanent Collection of MoMA 🔗 https://t.co/ggpM8XORDO
Tyler Morgan-Wall @tylermorganwall
25K Followers 208 Following R, data science, dataviz, maps, raytracing. Developer of rayshader, rayrender, and the rayverse | PhD in Physics | @Penn | tylermorganwall at foss to https://t.co/pBdBFqbrE2
Nicola Rennie | @nren.. @nrennie35
5K Followers 2K Following 💼 Lecturer in Health Data Science at Lancaster University. 💻 #RStats | Python. 🎨 Data visualisation. 🏃♀️ Distance runner. She/her. Views my own.
Alberto Cairo @AlbertoCairo
68K Followers 5K Following For news, follow me on BLUESKY: https://t.co/nN8zwUEmZs and LINKEDIN: https://t.co/BV7fInzN6w
R for the Rest of Us @rfortherest
25K Followers 220 Following You don’t need a PhD in statistics or years of coding experience to learn R, the most powerful tool for data analysis and visualization. Made by @dgkeyes.
Jakub Nowosad @jakub_nowosad
9K Followers 192 Following 🌐 Computational geographer. Assistant Professor at @UAM_Poznan. Co-author of https://t.co/5wDJ4L9v9V, https://t.co/SWQyjrJlN6, and https://t.co/06dwTiUgxz books.
Jon Schwabish @jschwabish
24K Followers 993 Following 📈Economist & DataViz 🕸@urbaninstitute @PolicyViz 🎙PolicyViz Podcast 📺YouTube step-by-step tutorials 🗞On Substack: https://jschwabish.subst 👀All views mine
David Robinson @drob
52K Followers 650 Following Director of Data Science at @Contentsquare. #rstats fan. Dad x2. He/him
Jenny Bryan @JennyBryan
36K Followers 640 Following Software engineer @posit_pbc, humane #rstats Trying the mastodon thing at: @[email protected] Also at: @jennybryan.bsky.social
Kevin Flerlage @FlerlageKev
16K Followers 3K Following Tableau Evangelist/Data Visualization Consultant at Moxy Analytics | 5X Tableau Visionary | 5X Tableau Public Ambassador | One Half of the Flerlage Twins
Wendy Shijia @ShijiaWendy
6K Followers 2K Following Data visualization designer, Tableau Visionary & Tableau Public Ambassador
Ren Yuan @_renyuan
1K Followers 74 Following Artist • Designer • Programmer - Generative Art | Computer Graphics | Machine Learning


Joseph Ricafort @josephricafort
690 Followers 697 Following See & Explore SE Asia Through Data | Digigraphics Designer for The Straits Times' Interactives (visual opinions are mine)
mattytwoshoes @mattytwoshoes
358 Followers 453 Following Decision Science for Analysts 📈 Come learn to make better data-informed decisions with me live 👉 https://t.co/WOIEIUlBR5

Richard Bamattre - @b.. @rbamattre
678 Followers 621 Following Local government data science lead. Not so recent PhD. Data viz, machine learning & data for social good. Tweets my own.
Nikos Pechlivanis @npechl
380 Followers 357 Following Bioinformatics & Data Visualization @INAB_Institute / @CERTHellas #Bioinformatics #RStats #dataviz
Fil @recifs
3K Followers 3K Following Vocateur. Data, maps & journalism https://t.co/Rkqi2Ij05j https://t.co/DgCttMivWc @[email protected] https://t.co/AqaM3OPtgr
Chris Henrick | @clhe.. @chrislhenrick
1K Followers 1K Following Software dev at @esri; prev @Google, @GreenInfo, @Stamen; Alum @MFADT; social justice, FOSS, GIS, percussion, cycling. he/him https://t.co/MDfFuV3li2
Miguel Mahecha @MiguelDMahecha
2K Followers 2K Following Earth system data sciences Prof. @UniLeipzig @RSC4Earth @UFZ_de, @iDiv, worried about climate extremes, biodiv. & the 🌎's future, editor @EnvDataScience
ESA Climate Office @esaclimate
12K Followers 476 Following European Space Agency's Climate Office, often tweeting about ESA's Climate Change Initiative programme
Jana Tauschinski @janatausch
787 Followers 805 Following graphics editor @FT | prev @BBCNews @the_young_fdn | data viz @LCCLondon
Nicki Camberg @nickicamberg
1K Followers 2K Following lead data journalist @chartmetric | formerly @AxiosVisuals, @CNNdatagraphics, @COVID19Tracking | live graph love | she/they
Rocío Márquez @arixha
1K Followers 2K Following Infographics @SCMPgraphics | Previous @elconfidencial @ec_diseno | Data + design + code = 🐱 | Feminista y animalista ✊
Saloni @salonium
29K Followers 2K Following Thinking & writing about science. Research @OurWorldInData. Co-founder @WorksInProgMag. 🇭🇰🇮🇳🏳️🌈
Carlos Hernandez @carlitos_m_h
3K Followers 3K Following Ingeniero Agronómo UNRC 🇦🇷 - Ms Student KSU 🇺🇲 Digital Farming Systems 🌱 👩💻🌎 🛰️
Catharina Neumann @Neumann_Ca
105 Followers 387 Following PhD student @FU_Berlin @mrillig lab @bio_move / movement behavior of filamentous fungi / x is a collective notebook, connect the dots
The {gt}/great_tables.. @gt_package
3K Followers 3K Following Table generation packages for R and Python. Helping you make beautiful tables since 2018. Join our wonderful Discord at https://t.co/QImzxY4SM8
ShinyConf @ShinyConf
1K Followers 917 Following The Annual #ShinyConf, powered by @Appsilon 💙 Step into the world where the #futureisshiny! 🗓️ Save the dates: April 17-19
Rachael Dempsey ...@r.. @_RachaelDempsey
3K Followers 2K Following Host of the Data Science Hangout: https://t.co/cuVraBiACb Random things that make me happy: live music, cats, snowboarding, making pretty cheese boards
Tesla DuBois @TeslaDu.. @TeslaDuBois
494 Followers 571 Following @[email protected] Perpetual learner | #Rstats | #GIS | Lecturer, student, researcher, mom |
Ciera Martinez, PhD @CieraReports
1K Followers 1K Following Senior Program Manager at Schmidt Center for Data Science and Environment UC Berkeley Open Research, Software, and Community she/her
FatBear @FatBear_bio
97 Followers 1 Following FatBear wildlife science solutions Data analyses and capacity building in animal movement, habitat selection and connectivity modeling
zedela @zedelaberlin
5 Followers 1 Following
Jasmin Sarah König @jasminskoenig
299 Followers 698 Following Doctoral Researcher @uhh, guest @DukePoliSci, studies populists, courts & their interactions. Loves #dataviz, #rstats & #ggplot. Private account, her/she
Sonja Peteranderl (ev.. @glocalreporting
5K Followers 1K Following Crime/OC/Tech/Future. Founder BuzzingCities Lab, OpenCrime, School of Conflict&Peace. Check reports @DerSPIEGEL SWR Vollbild @WIRED. AI Fellow @algorithmwatch
Galselo Wrapsy @galselo
570 Followers 697 Following Ci piacciono i grafici. Dashboard clima https://t.co/wuslEbVm8U Cover image @tomgauld
Duncan Bradley @duncanbradley_
127 Followers 136 Following PhD Psychology at @OfficialUoM. Researching how we understand information in data visualisations 📊 Also interested in open research and #rstats. he/him
Nahel Belgherze @WxNB_
51K Followers 2K Following Covering extreme weather events around the world. Also interested in climate dynamics, geohazards & satellite remote sensing. Views are my own.
David Spratt @djspratt
9K Followers 3K Following Research Director, Breakthrough National Centre for Climate Restoration. https://t.co/xrB8PG7KJQ. Personal tweets. Blog: https://t.co/x1WZANJEcZ
Loris Mat @lorismat_
284 Followers 217 Following Freelancing in #dataviz & #webdesign #creativecoding otherwise 🖋️🎨 💻 in #threejs #glsl #d3js mostly
Explained @__explained
237 Followers 7 Following We turn your complex data into charts, maps, visuals and data stories. Contact us if you want to use our visuals or collaborate with us: [email protected]
Doug Dowson @doug_dowson
977 Followers 595 Following Data journalist at @TheEconomist covering business and economics. Past: @USTreasury @PIIE @CenterOnBudget


AfricaInNumbers @AfricanNumbers
130 Followers 135 Following Explaining a misunderstood continent using open source data 🌍📊
Genuine Impact @genuine_impact
16K Followers 36 Following You're only seeing 5% of the charts we do. Check out all of them in our newsletter 👇
Winifred @MissAmase
861 Followers 366 Following Data visualization designer | Freelance Data Journalist @coingecko | I turn my curiosity to visual stories
Arijit Gupta @Arijitdesignsit
59 Followers 115 Following Kabhi Data, Kabhi Design! (Sometimes Data, Sometimes Design!)


Marco Sciaini @shinysci
1K Followers 1K Following 🗺️ | 📈 | 🔍 | 🐶 | 🛰️ | 🍜 | ☕ | Freelance Developer and Analyst

Mihály Minkó @nezach
211 Followers 227 Following Data visualization evangelist, teacher and hobbyst.
Federica Gazzelloni®.. @FGazzelloni
3K Followers 5K Following @IHME_UW |@R4DScommunity |@RLadiesRome |@Bioconductor |@TheCarpentries 🔗GitHub: https://t.co/G5ROFUJv57 🔗YouTube: @federicagazzelloni
DEEPSHA MENGHANI @bigdatadipper
453 Followers 489 Following Data Scientist at Microsoft #RStats #QuartoPub #DataViz … Opinions are my own. Pronouns - she/her
Stefan Pullen @DataVizStefan
702 Followers 267 Following 📊 Information Designer || Data Visualization Specialist || Helping organisations by crafting impactful Data-Driven stories.
Zoom in to see the red disappear — striking!

Color opponency: the can appears reddish even though it’s only black and white dots surrounded by cyan.


Day 23 of the #30DayChartChallenge - Tiles: The Arsenal Invincibles season.

@CedScherer Thanks! That's what I did, and also tried ggh4x, I preferred the second one

Heute haben wir bei @cemas_io unsere neue Datenbank zu Rechtsterror in Deutschland veröffentlicht 👇 „In der neuen Datenbank wurden von CeMAS 50 rechtsterroristische Fälle systematisch erfasst und kategorisiert.“ cemas.io/publikationen/…
🦕10 years ago, I began sharing my early #rstats graphs online. I remember a colleague making fun of me, asking if I really wanted to compete with stack overflow. 🙃 ⏰ In the last 30 minutes, 305 ppl used the R graph gallery! Grateful for everyone's support! 🙏🙏


[🆕POST] This year, it took me a while to be able to make the first post, but here I have the first about creating grouped proportional symbols for you! #rstats #dataviz 📖dominicroye.github.io/en/2024/map-of…

@EvaMaeRey @CedScherer @cararthompson @_ansgar I would probably use geom_text() with data = . %>% filter() and then nudge the labels
@EvaMaeRey @CedScherer @cararthompson @_ansgar I was thinking about labels only, for callouts I would do the same but with ggrepel instead
I am still looking for speakers for Workshops for Ukraine series for summer! If you want to teach a workshop on #RStats, #Python or some other data/research related topic, DM or email [email protected]. Some potential topics in QT, but feel free to suggest other too!
Looking for more speakers for Workshops for Ukraine series (weekly 2-hour workshops on #RStats, #Python + more), where all proceeds go to support 🇺🇦! More info: bit.ly/3wBeY4S If you are interested msg on here or email me at [email protected] 1/3

I spent time today calculating weighted averages. They're like moving averages, except with extra emphasis on recent values. For a bit of a fun, I packaged the math in JavaScript as an @observablehq notebook. Hope it's useful to someone sometime. observablehq.com/@palewire/weig…

The cheaper the brand, the more polyester they use
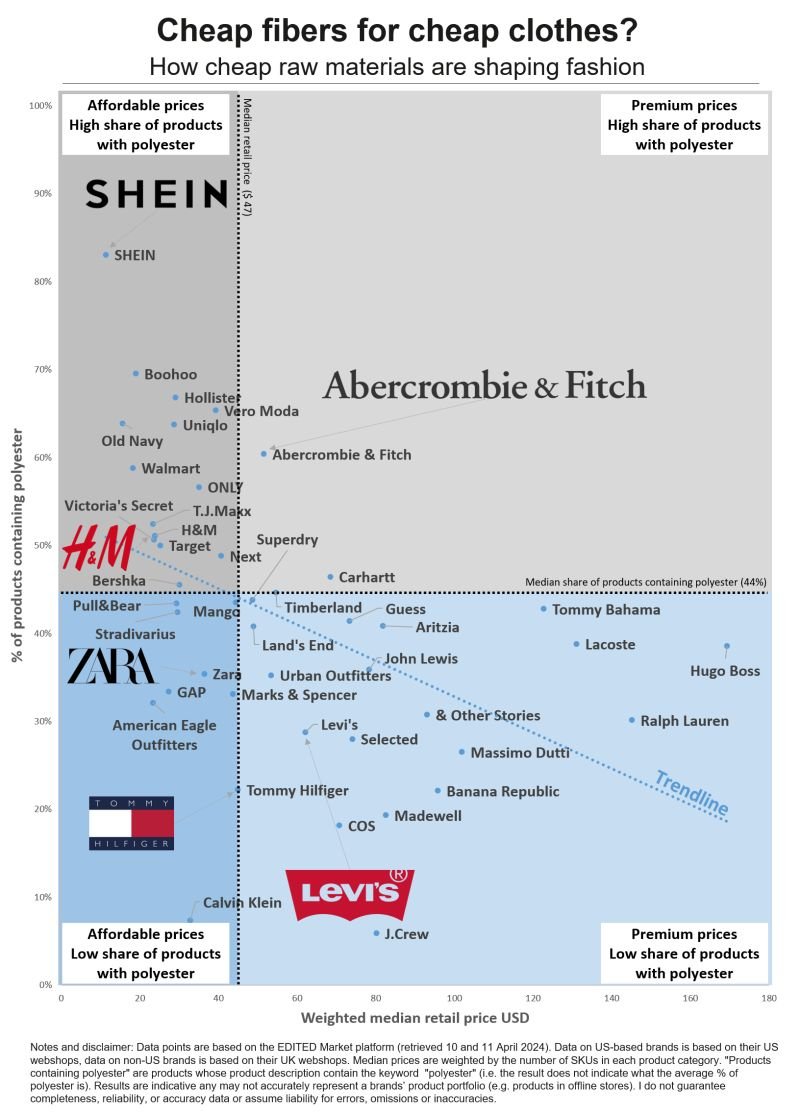
“Sheinification” refers to the enshittification of clothing quality, driven by fast fashion Here's WTF is happening in the fashion industry & why the quality of clothes has 📉...

@CedScherer @Datawrapper For when your Simpsons stats don’t look enough like the Dakotas.
Day 8. Circular. Spent way too much time on this one 😁. It’s a story about Moscow Red Book birds. It’s a bit of dream catcher, bit of bird snares with a little bit of sky. Black strings mean extinct species, but there are yellow ones — recovered species. #30DayChartChallenge


Doodle for #30ChartChallenge Day9 - Major/Minor. Our minor (£) and major (£££) grocery shops of 2023. Mostly go to our local off-license for specific items (usually Ritter Sport chocolate 😅). We do most of our shops in Tesco, but shoppings are smaller than when we go to Lidl.


Here is the population pyramid I made a while ago for Qatar (in Excel). Very unusual by European standards.


[SPOILER ALERT] 🚨 Pam and Jim's relationship is one of the central themes of The Office. The chart illustrates how their relationship evolves based on how likely they are to appear in the same scenes. #30DayChartChallenge | #Day13 | Family #rstats 📊

Day 13 of the #30DayChartChallenge - Family: The Splash Brothers #StephCurry #KlayThompson

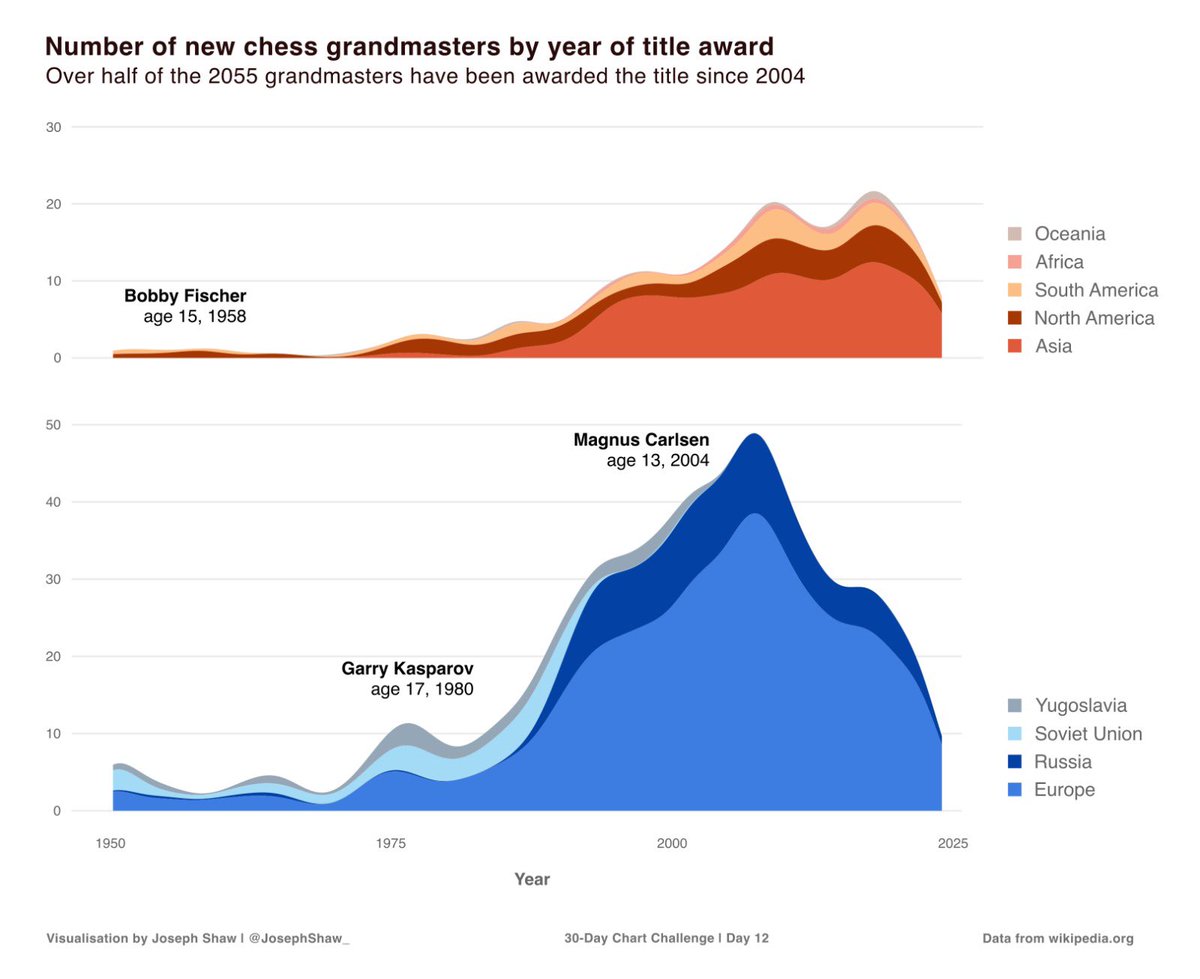
@30DayChartChall Day 12 of the #30DayChartChallenge - Reuters Graphics (style): new chess grandmasters by year
Day 13: Family of #30DayChartChallenge I explored whether there are some #relationships between Fertility and Maternal Mortality over the years. For #ASEAN, #Laos and #Myanmar have significant changes in #Maternal #Mortality ratio over a short period of time.

Trends for United States
You might like