NAIST MATLAB Ambassador @NaistMatlab
NAISTのMATLAB Student Ambassadorの活動記録。 Joined August 2021-
Tweets194
-
Followers134
-
Following57
-
Likes187
Matlab FingerPrint Recogition Code This program take one fingerprint as input and compare it with the fingerprints in the database. If a match is found , it display the ID of the owner of the fingerprint.github.com/Darin-Sarra/MA…

Data Analytics with MATLAB Webinar Files Using Data Analytics to turn large volumes of complex data into actionable information can help you improve engineering design and decision-making processes. (mathworks.com/matlabcentral/…), MATLAB Central File Exchange. 取得済み October 4

Bland-Altman and Correlation Plot This customizable data analysis tools generates a Bland-Altman and correlation scatter plot. Data can be displayed using color and shape coding of groups using a 2D or 3D matrix notation. (mathworks.com/matlabcentral/…), MATLAB Central File Exchange

Multivariate and Univariate Time Series Prediction Abolfazl Nejatian (2023). Multivariate and Univariate Time Series Prediction (mathworks.com/matlabcentral/…), MATLAB Central File Exchange. 取得済み October 4、2023.

【MATLAB&Simulink紹介セミナー@Zoom 開催のお知らせ】 2023年9月27日(水) 17:30~18:30 本セミナーでは、 MATLAB & Simulink を様々な事例を通して紹介します。将来のキャリア形成にも繋がるMATLAB & Simulink を是非お役立て下さい。 申込は下記よりお願いします。 forms.office.com/pages/response…
Super fast and terse kmeans clustering. This is a super duper fast implementation of the kmeans clustering algorithm. Mo Chen (2023). Kmeans Clustering (mathworks.com/matlabcentral/…), MATLAB Central File Exchange. 取得済み September 14、2023.

CNN / Transfer Learning Example Usually training CNN costs us a lot of time and GPU cycles. One key technique to avoid this type of cost is "transfer learning". This example shows how we can try "transfer learning" using MATLAB.

Classify Sentiment of Tweets Using Deep Learning This example demonstrates how to build a deep learning model in MATLAB to classify the sentiment of Tweets as positive or negative. This also includes an example of reading data from the Twitter API using Datafeed Toolbox.

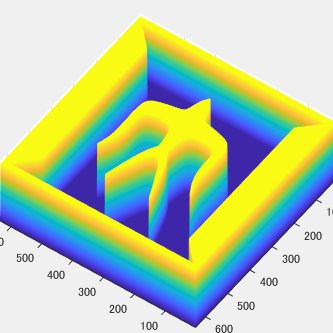
Principal Component Analysis (PCA) on images in MATLAB (GUI)

A domain adaptation toolbox Wrappers and implementations of several domain adaptation / transfer learning / semi-supervised learning algorithms, including:* (TCA)* (MIDA)* (SA)*(ITL)* (GFK)* (SSA)* (LapSVM)* (LapRR)* (TSVM)* (KPCA)github.com/viggin/domain-…

Apollonian gaskets Function to compute and display the apollonian gasket of any 3D triangle or 3D regular polygon github.com/NicolasDouille… Nicolas Douillet (2023). Apollonian gaskets (github.com/NicolasDouille…), GitHub. 取得済み August 17、2023.

Adaptive threshold method segmentation Adaptive threshold method segmentation. Filter size and statistical operator adjustment. mohd akmal masud (2023). Adaptive threshold method segmentation (mathworks.com/matlabcentral/…), MATLAB Central File Exchange. 取得済み August 17、2023.

NetworkVisualizer NetworkVisualizer is a graph visualization library designed for Matlab. It provides a convenient and highly customizable way to create network/graph figures, especially for bioinformatics or biomedical networks such as protein-protein interactions (PPI).

PIVlab - particle image velocimetry (PIV) tool with GUI PIVlab is a GUI based particle image velocimetry (PIV) software. It does not only calculate the velocity distribution within particle image pairs, but can also be used to derive. 2021, doi:10.5334/jors.334.

Correlogram The correlogram function efficiently generates plots to visualize the correlation matrices. Serhan Yilmaz (2023). Correlogram (mathworks.com/matlabcentral/…), MATLAB Central File Exchange. 取得済み August 17、2023.

Addaxis Adds multiple axes to plots using addaxis.m. Automatically adjusts axes to accomodate as many axes as you want. Add more plots to any added axes with addaxisplot.m Add y-labels to any of the axes with addaxislabels.m mathworks.com/matlabcentral/… MATLAB Central File Exchange


うえの@MATLAB Stud... @ueno_matlab_amb
102 Followers 157 Following 電通大 MATLAB Student Ambassador / B4 先端ロボティクスプログラム / 発言は個人の見解です

実乃梨 @shi_li33601
26 Followers 404 Following 学生🚺 / 157 / M質 / 寂しがり / 色気ないですけどよかったら 🍷 https://t.co/iPI1mgFinx


enjoyMATLAB @EnjoyMATLAB
0 Followers 95 Following

iwasato takuya@MATLAB... @SCISEL1990
819 Followers 2K Following 「 #MATLAB #LabVIEW で困った…」をお手伝いしています!XではMATLABやLabVIEWを含めたちょっとした出来事などをポストしています。代行のご依頼やご相談は→ DM又は[email protected]


ぼらぼら @borabora2020229
164 Followers 301 Following #アメフト、#ラクビー、#野球、などのスポーツを中心にいいねしたりリツイートしたりぼやいたり…😁 #NAIST、#奈良先端大、のOB🏫でも #GoWithTheBrave #ラグビー日本代表 #Buffaloes #大谷翔平 #Orioles #Birdland #ギャングスターズ #Gangsters

CyberSuccès @AkSucces
7 Followers 97 Following In the digital age, online marketing has become the cornerstone of success for businesses worldwide. Welcome to our blog
ALTEX Minegishi @Altexcorp_Akiko
275 Followers 576 Following 「 #ありたい未来 」の実現に必要となる変化する価値を生み続ける企業の社長アカウントです。#制御工学 ・ #熱電発電 ・ #Care222® 関連のつぶやき多し。34年の半導体ノウハウを活かし、社会課題解決コーディネート活動も開始しました! あなたの「ありたい未来」を教えてください。 #ALIMI
Kenta@ImVisionLabs In... @imvisionlabs
2K Followers 152 Following 3次元点群や画像データの受託開発・研究開発を行う東大発スタートアップ企業です。森林管理・スマート農業・インフラ管理・自動運転など、様々な分野で3次元データ処理で役立てないか日々模索中です。日ごろの勉強した結果やプログラミングしてみた結果を投稿します。
(New) MATLAB Ambassad... @MATLAB_JAIST
62 Followers 95 Following You are in the space of MATLAB Community at JAIST (New Account)

H哈哈哈那啊呀�... @ljkcomeon
21 Followers 389 Following
Tuttaka @northyuto22
26 Followers 453 Following
村上 遼 𝕏 Ryo M... @RyoMurakami_WPI
3K Followers 3K Following 手術ロボット工学者見習い(Neurosurgery)/Worcester Polytechnic Institute 、Ph.D. Candidate/南沢奈央さんの大ファン/何かご一緒できることがあればお気軽にご連絡ください: [email protected]

Jose Avila Peltroche @JoseAvilap89
547 Followers 1K Following Half peruvian🇵🇪/half seaweed🏖🔬 Phycologist (I study seaweeds). Currently enjoying life and publishing
Angelo Yeo @ayeo_MWK
9 Followers 46 Following
NIYONKURU Elysé @NIYONKURUE94113
0 Followers 19 Following
Andy Mau @nddmau
37 Followers 159 Following AI Speech Researcher @ JAIST | MATLAB Student Ambassador @ MathWorks
yoshinobu takemoto @4pc_pantomime
50 Followers 46 Following MathWorks | アプリケーションエンジニア| 個人的見解| 趣味音楽 |
Sodjy Disleydjy @Sodjyhopilan
111 Followers 257 Following

Hefei Zhao @HefeiZhaoPhD
185 Followers 1K Following Food Scientist, Oil Chemist, Spectroscopy Specialist, Programmer, Data Analyst, Editorial Board Member of ‘Food Science & Nutrition’ journal (Wiley, IF3.6, Q2)
おるつ @orz_hz
100 Followers 1K Following

待鳥佳奈子@MathW... @KanakoMachidori
241 Followers 221 Following マスワークス日本法人の人事部長 の個人アカウントです。 関心は、人材育成、組織開発、エンゲージメント、DE&I、キャリア開発、ウェルビーング、Employee Experience、人が奏でるストーリー、心理学(NPL、ポジティブ心理学、アドラー、NVC他)、等。趣味は脳、心身を整えること、山歩き、マラソン。左利き。
西 祐樹 Yuki Nis... @y_nishi_pt
2K Followers 427 Following 長崎大学生命医科学域助教.畿央大学ニューロリハビリテーション研究センター客員研究員.理学療法士, PhD.LabVIEW, MATLAB, R, Pythonを扱ってます.主な研究は疼痛, しびれ感, 運動制御.弓道四段
わき氏(Ryosuke M... @wakishi_
210 Followers 577 Following 美味しい珈琲が生き甲斐 / Debugging, Windows Internals, Browser (Chromium Edge), Azure PaaS (App Services) あたりがキーワード

Nao @naogeo
536 Followers 1K Following 博士(工学)。電脳小物好き。地球科学(海洋地質学)専攻。技術士(応用理学、建設)。興味あることには何でも手を出す性癖あり。MATLABに手を出してます。
IWASHIMA Satoru岩島... @SIwa23288585
2K Followers 1K Following pediatric cardiologist, PhD, Chutoen general medical center, clinical professor of hamamatsu university school of medicine #小児循環器科指導医 #日循情報広報部会協力員サポータ #MATLAB
空間制御(調整�... @HyperTurbo1993
126 Followers 446 Following ご覧のとおりツイッターアカウントです よろしくお願いいたします‼ MATLAB芸人になりたい!実はCATIAできる芸人
某エレキ雑誌の... @if_CQ_naka
2K Followers 3K Following トラ技( @toragiCQ )の人(長).編集後記(54).トラ技団員.実務シリーズ「トラ技SP( @toragiSP )」学生向け「トラ技ジュニア( @toragiJr )」も.IT農林水産担当(非公式),伝わりやすい専門技術記事の書き方の普及活動とかしてます.イラストは見ル野氏( @toriopon )
yutan_h @akadih6562
35 Followers 363 Following
芝浦工業大学 �... @SIT_mathclub
226 Followers 216 Following 芝浦工業大学 数理科学研究会の公式アカウントです。主に数学と物理をやってます。興味のある方は気軽にDMしてください!
荒原貴子 | Global... @TakakoArahara
74 Followers 54 Following @MathWorksのGlobalizationチームで製品の英日のローカライズに携わっています。投稿は個人的な見解です。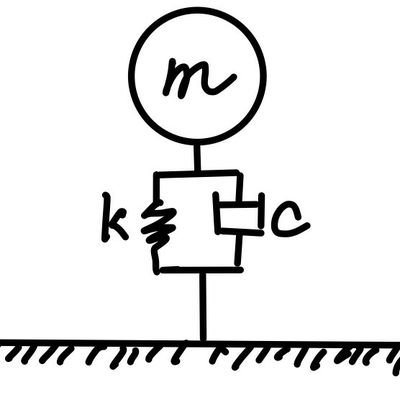
MATLABパイセン @MATLAB33761100
1K Followers 718 Following 日本の製造業を応援すべく、機械エンジニアの「車輪の再開発」の防止と業務効率化の手助けをモットーに活動。専門である振動騒音工学や音響工学について、プログラムを示しながら解説。大学の授業よりもわかりやすく説明することを目指す。質問頂ければ、回答したいと思います。


東京電機大学 MA... @TDU_MATLAB_Amb
114 Followers 137 Following @MATLAB Ambassador /中の人は東京電機大学 工学部 電気電子工学科 4年/ツイートは個人的見解であり、所属組織とは関係ありません。
EBSLLC /合同会社�... @enharmonic_llc
769 Followers 4K Following 海外展開支援コンサル。アメリカ留学経験あり。クラリネット専攻、工学部専攻、ビジネス英語できるけどGrammarlyに修正を食らう日々。英語コーチングもやろうと思えばできます。ぽこちゃにハマり、ライバー事務所も始めようかと模索中。🇺🇸の取引先とコミュニケーションに困ったらお声がけください。
Kojiro Saito | MATLAB... @Kojiro__Saito
943 Followers 280 Following MATLABのスキルほぼゼロでMathWorksに入社し、現在はMATLABコミュニティの上位コントリビューターの一人。Apple Watchで測定したデータを可視化するのが趣味。メガネはボストン型を愛用。個人的見解 #MATLAB #MathWorks
Andy Mau @nddmau
37 Followers 159 Following AI Speech Researcher @ JAIST | MATLAB Student Ambassador @ MathWorks
(New) MATLAB Ambassad... @MATLAB_JAIST
62 Followers 95 Following You are in the space of MATLAB Community at JAIST (New Account)
西 祐樹 Yuki Nis... @y_nishi_pt
2K Followers 427 Following 長崎大学生命医科学域助教.畿央大学ニューロリハビリテーション研究センター客員研究員.理学療法士, PhD.LabVIEW, MATLAB, R, Pythonを扱ってます.主な研究は疼痛, しびれ感, 運動制御.弓道四段
MATLAB @MATLAB
101K Followers 864 Following MATLAB is a high-level language and interactive environment for numerical computation, visualization, and programming 📲 Follow us on Instagram @MATLAB
東京電機大学 MA... @TDU_MATLAB_Amb
114 Followers 137 Following @MATLAB Ambassador /中の人は東京電機大学 工学部 電気電子工学科 4年/ツイートは個人的見解であり、所属組織とは関係ありません。


JAIST MATLAB Ambassad... @JAISTMATLAB_amb
71 Followers 25 Following Welcome to the MATLAB & Simulink page for Japan Advanced Institute of Science and Technology (JAIST) by MATLAB-JAIST Ambassador
NAIST (English) @NAIST_MAIN_EN
786 Followers 29 Following Nara Institute of Science and Technology (NAIST) is a Japanese national university located in Nara, Japan.
NAIST 物質創成�... @NAIST_MS_JP
489 Followers 27 Following 奈良先端科学技術大学院大学 物質創成科学領域の公式Twitterです。領域のニュースなどを掲載します。
生物物理若手の... @bpwakate
2K Followers 2K Following 生物物理若手の会公式アカウントです!生物物理若手の会の各支部主催のセミナーや夏の学校、交流企画等の情報を投稿します。どなたにでもご参加いただける交流用のDiscordサーバー「憩いの場」を運用しています (参加登録希望はこちらから→https://t.co/nZLg04kny7)
NAIST 物性情報物... @SSIPlab_NAIST
85 Followers 18 Following 奈良先端大 物性情報物理学研究室の公式アカウントです。 An official account of the Solid-state Information Phyisics Lab. in NAIST.
しまげん @shimagen7
89 Followers 439 Following
NAISTバイオサイ�... @NAIST_BS
1K Followers 51 Following 奈良先端科学技術大学院大学 バイオサイエンス領域広報です。 ご質問等への返信は行っておりませんのでご了承ください。 ホームぺージ:https://t.co/pIUcWzt5M8

奈良先端科学技... @NAIST_MAIN
3K Followers 138 Following 奈良先端科学技術大学院大学(奈良先端大)公式X(旧Twitter)です。奈良先端科学技術大学院大学のイベント、ニュース、研究成果などをお伝えします。個別のご質問にはお答えできませんのでご了承ください。
matogawa @LA_T_rt
419 Followers 1K Following NLPer somewhere ◀︎◀︎ NAIST IS NLP ◀︎◀︎ B.A. in Literature (linguistics)
高田陽一郎 Youic... @yt_geodesy
831 Followers 914 Following 固体系の地球物理学者(宇宙測地学+地震学、地質学と地理学にも興味あり)。登山とスキーが好物。SAJテクニカル。twitter初級者。脳が疲労した時にtweetするので一貫性はありません。


kura3559 @kura3559
63 Followers 542 Following 組み込みCプログラマ。たまにC#。C++とPython勉強中。かつて名古屋つ部にも出没。メタルと70sと80s。クイーン。micro:bitでいろいろ遊んでます。goとMATLABにもてをだしてしまった(笑)
Ryota Kimura (木村�... @RyotaKimura
460 Followers 3K Following Hello! / #Wireless communication / R&D / Ph.D. / #C , #JuliaLang & #MATLAB learner / #Cooking / Scha Dara Parr #SDP / Tokyo No.1 Soul Set #T1SS / Buffalo Goro

Kenichi Iwase @Iwacchaan
2K Followers 5K Following 愛知県の自動車部品メーカーの子会社でエンジニアしています。業務ではMATLABを中心にPythonやM365を使っています。機械学習やAI、AWS、Google Cloudの勉強をしています。ピアノとドラムも月3回ずつレッスンに通っています。クラウド上にホームページを立てることを目標に学習を進めています。
ゲラン @_hi_qwerty_
42 Followers 139 Following 音楽、機材関係等たまにつぶやき。dub、dubstep、houseとか犬とか。訳あってただいまほぼ休眠中につき。


ツッチー @mistilteinn057
225 Followers 2K Following
KingArthur @kingarthur7281
112 Followers 235 Following 自宅療養中のゴリラ 最近脱Dしました(理学) 今はデータ貰って弄くるだけで会社からお金貰えるニートやってます あらゆるレスは議論を深めるためなので反論歓迎します
伊良皆 拓(Hirak... @ira_hira
324 Followers 96 Following 京都 / 認定医学物理士 / 博士(工学) / 東京理科大物理→京都大院工学原子核 / 修士・博士とも認定医学物理教育コース修了 / 医学物理若手の会(YRAMP)元会長
ヒロシです..... @hhhhhhhiroshi
325 Followers 4K Following 猫ひろし★舘ひろし★五木ひろし★藤岡弘★久米宏★かまやつひろし★円広志★生島ヒロシ★阿部寛★関口宏...
レタPON @pon_reta_pon
222 Followers 1K Following 暇があれば美術館巡りしてます。 空の境界、おすすめです。 ネコはモフモフしたい派。 最近はロボットと仲良し。 アイカツエンジニア&かんそくしゃ。 vrchat……RETA_P
jiro_MWJapan @jiro_MWJ
247 Followers 95 Following Engineer @MathWorks since 2006, Engineer @MathWorks Japan since 2014. ※ Views are all mine. 発信情報は全て個人的な見解です。EN=@jiro_mw
Shinsuke Okayasu @O_ka_Shin
22 Followers 199 Following

コツメカワウソ... @MATLAB_Otter
384 Followers 257 Following
Macindows @Macindows
76 Followers 269 Following An inmate in audio asylum since 2003,オーディオに囚われの身 NW Transport:Slim Devices Transporter, DAC: PrismSound Lyra2, LavryBlue,LavryBlack DA10,Benchmark DAC1,etc
Kats Sato @kawauso_kun
675 Followers 2K Following 自動車関連企業の技術系計算インフラ運用を生業とする。興味、関心のある事柄をメモ代わりにツイート/RTしています。 たまに、猫が割り込みます。

ヘルニアいっぬ... @neginegace
444 Followers 712 Following スプラ1/S+86 2/X25↑ 3/X25↑ 呼び名は『ねぎ』『ヘルニア』『いっぬ』でお願いします MATLAB垢としても併用💡MATLAB Answers 4歳🐾 All tweets are my own🐾
leftbank @cafe_on_the
2K Followers 3K Following 趣味は音楽と写真など。 パートはギター&キーボード。 ビートルズ、ウイングス、イーグルス、クラプトン、イエス、S&G、オフコースなどが好きです。メーカーの研究所でオーディオ/ビデオのデジタル信号処理アルゴリズム関連(~2015/3/15)→ オーディオ系ベンチャー → AudiiSion Sound Lab.創業
MATLABパイセン @MATLAB33761100
1K Followers 718 Following 日本の製造業を応援すべく、機械エンジニアの「車輪の再開発」の防止と業務効率化の手助けをモットーに活動。専門である振動騒音工学や音響工学について、プログラムを示しながら解説。大学の授業よりもわかりやすく説明することを目指す。質問頂ければ、回答したいと思います。
Mikio @ MATLABのCust... @mikio_cse
1K Followers 749 Following MathWorks Japanで大学教育・研究分野での #MATLAB #Simulink に関する技術支援を担当/元・音響製品開発エンジニア/Minidrone Competition 担当エンジニア/自分のキャリアもたまに発信 ※Tweets are mine
Trends for United States
You might like