Slides Revolution @SlidesR
L'actualité du monde des applications pour réaliser vos slides #presentation, #slideshow, #software, #powerpoint, #keynote, #googleslide, #explee,#powtoon slides-revolution.com Ile-de-France, France Joined March 2016-
Tweets25
-
Followers15
-
Following230
-
Likes0
data-intelligence-forum.fr: opportunity to discover new actors of the french tech #datavisualisation #cybersecurity

Analyse and report SurveyMonkey surveys in one click for free using Surveywonders.
presenternet.com translates your PowerPoint presentations into online surveys. Even Macgyver couldn't do it !
presenternet.com translates your PowerPoint presentations into online surveys. Even Macgyver couldn't do it !

Color can make or break your data visualizations. Read our do's & don'ts here! #dataviz #ddj hubs.ly/H02w8wL0

Documation : un salon gratuit sur le contenu et la transformation numérique (6-7 avril à Paris) blogdumoderateur.com/salon-documati…

#scodalikes The collection of articles at points.datasociety.net will help you think through the ethical implications of working with data.

We’ve listened to your feedback and Tableau Server 9.3 now includes a workbook’s revision history! tabsoft.co/1RvCWqg
Welldone and farewell GoCardless


Save Painful PowerPoint Presentations with Twitter slidegenius.com/blog/save-pain… #socialmedia #smm #digital

Universities should ban PowerPoint — It makes students stupid and professors boring via @dibbygibby @adambjerre uk.businessinsider.com/universities-s…

Need help in creating a marketing #presentation that rocks? @erinsagin explains her 13-step formula here: buff.ly/25rSMXn

SMS from your PC or Mac, using your Android Phone Number.

Need to create an interactive #presentation in a jiffy? We'll show you how! bit.ly/1n8CIIx #productivity
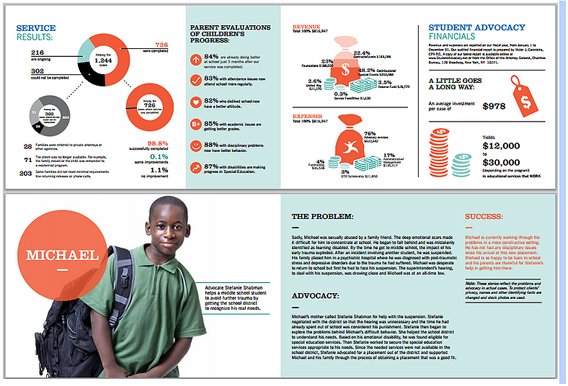
The Ultimate Guide to Infographics for Nonprofits: bit.ly/1WqzpYK #socialmedia #infographic
ZippList : les meilleurs outils gratuits pour les créatifs (banques d’images, polices, icônes…) blogdumoderateur.com/zipplist-meill…

The five questions we ask each of our prospective #Prezi designers buff.ly/1Rjpc1X

Need to compare stuff? Visualize the differences using these #infographic templates! bit.ly/1QZhKIY #apps
Transform your Google Slides presentations into video with Chrome youtu.be/UUtWFa_oCLg?li… via @YouTube
Interesting post by @aghoshal “Run presentations from your phone with Google Slides ...” tnw.to/q3Pm3 via @thenextweb

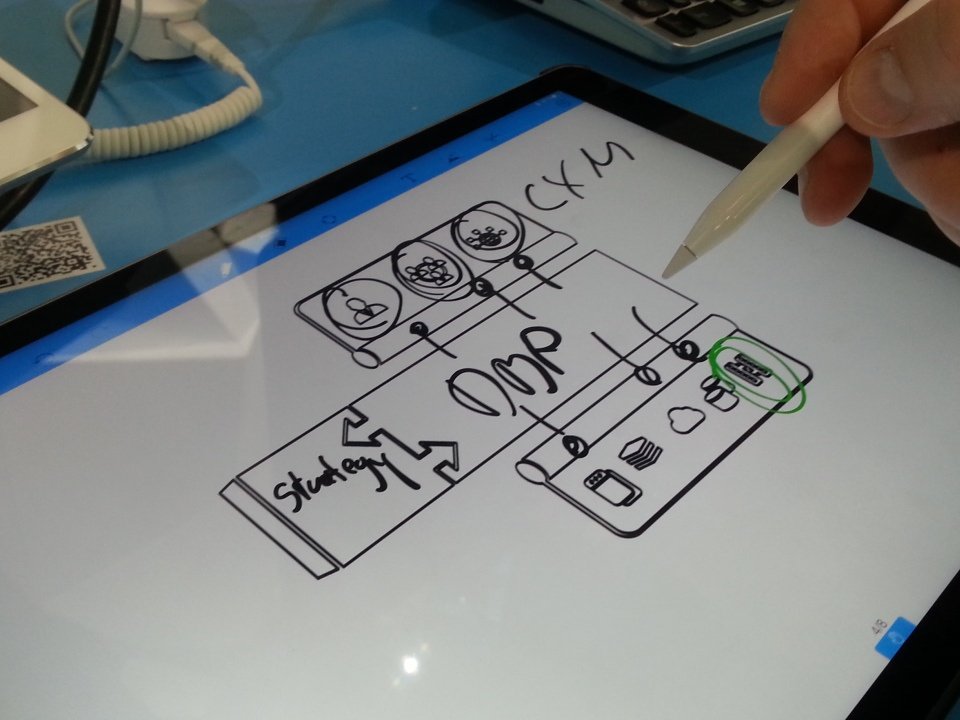
Forget #PowerPoint ▶Paper is back ▶Visit @SoftwareAG #CeBIT develop your digitization @joergklueckmann @GFalkenberg


Slide Impact @TheSlideImpact
31 Followers 38 Following Slide Impact helps clients in creating presentations that tell stories which leave a long-lasting impact. [email protected] +233 20 623 7723
mbnajmussakib @mbnajmussakib
245 Followers 4K Following i am singer without music.trainer in Microsoft office.🎙️🎙️
Graphic Designer @shnisan
771 Followers 4K Following Hey! This is NISAN. I Provide Highest-Quality #Graphicdesign #Logo #Flyers #Postcard #Brochure #Stationery Design & Photo #Retouch - ---👉 [email protected]
Cristina Meloni @CristinaMeloni6
267 Followers 1K Following Statistician, Financial Translator, Interactive Datavisualizer, Tennis Lover, Catlady, Traveller. https://t.co/DPAVsEBddf
SOLAN DESIGN @SOLAN_DESIGN
501 Followers 4K Following #DESIGN - #Graphic #presentation #templates #powerpoint
data+visual @dataplusvisual
606 Followers 275 Following data+visual = 📊 and is a group for anyone interested in the world of data visualisation. Newsletter at https://t.co/iTNkDvQ55A run by @erichannell

Synthia Silloway @dinscare92
746 Followers 3K Following The whale is endangered while the ant continues to do just fine. Tap Tha Link In Bio to make $5330.88
Julien Wazné @julienwazne
17 Followers 117 Following
natashaabbie @natashaabb1
2K Followers 3K Following
HILDA 2025 @hildaworkshop
479 Followers 398 Following Workshop on Human-In-the-Loop Data Analytics, Co-located with SIGMOD 2025
DataIsYourAsset @dataisyourasset
276 Followers 910 Following Data driven insights. Talking Analytics, Data Visualisation, IoT, BI and anything else on data. #dataculture #legalit #legaltech
EmpoweredPres @empoweredpres
4K Followers 4K Following Award Winning #PresentationDesign #Honolulu #Hawaii. Specializing in #Powerpoint #Keynote #PitchDecks #TED #ContentMarketing #Startups @coryjim @yanceyu
Elean @eleananalytics
422 Followers 639 Following Mesurez en un coup d'œil le ROI de vos campagnes eMarketing - #webmarketing
SlideBot Team @SlideBotIO
15K Followers 17K Following The best tool to create powerful presentations in seconds. Trusted by TEDx speakers.
Incubateur Télécom ... @IncubTelecom
8K Followers 1K Following Suivez nos startups #numérique #deeptech (#data #IA #blockchain #cyber #impact #robotique) @telecomparis @ip__paris et notre https://t.co/XrGe57FKcl
Paris Business Angels @Paris_BA
9K Followers 824 Following Un des 1er réseaux de #BusinessAngels en France qui finance et accompagne les #startups en amorçage ! [email protected]
Bertrand Miserey @BMiserey
227 Followers 203 Following
Information Design Co... @Infodesigncon
1K Followers 160 Following The Dutch Information Design Conference - An inspiring day full of #infographics, #dataviz and everything else in visual #storytelling. IDC25 - 31 October 2025
Tableau Public @tableaupublic
71K Followers 1K Following Share, create, and explore @Tableau data visualizations for free on Tableau Public. For more inspiration, view our #VizOfTheDay and connect with our #DataFam ❤️
WNYC Data News Team @datanews
6K Followers 326 Following Practicing data-driven journalism, making it visual and showing our work. Pitch us - DM / email datanews at wnyc dot org
OpenStreetMap @openstreetmap
83K Followers 219 Following OpenStreetMap is the free editable map of the whole world. It is made by people like you! @[email protected]
John Burn-Murdoch @jburnmurdoch
481K Followers 6K Following Columnist and chief data reporter @FinancialTimes | Stories, stats & scatterplots | Senior fellow @LSEdataScience | [email protected]
Ross Crooks @rtcrooks
1K Followers 456 Following Business is for good. Co-founder @columnfive, co-author of Infographics (https://t.co/24iMAs4Fjn)
Interactive Data Lab @uwdata
8K Followers 282 Following Visualization & data analysis at @uw @uwcse. In a previous life was the Stanford Vis Group.
Create With Data @createwithdata
2K Followers 527 Following Data visualisation articles and books by @peter_r_cook. (Name changed from @animateddata.)
datavisual @datavisualinfo
501 Followers 393 Following Data visualization software for designers to easily make beautiful charts, graphs and maps. Publishing daily visualizations on current events.
10h11 @10h11
2K Followers 1K Following 10h11 designs tailored solutions using your data: automation, dashboards, and visualization. A fast-moving, results-oriented team.
AVS / Advanced Visual... @avsviz
334 Followers 608 Following Combine our data viz products and services with your existing investments to create powerful, insightful solutions!
Rediff Labs - Data jo... @RediffDataJourn
308 Followers 773 Following Data Journalism projects from Rediff Labs
Bloomberg Graphics @BBGVisualData
79K Followers 171 Following Graphs, maps and data journalism from the Bloomberg Graphics team.
Jeffrey Shaffer @DataPlusScience
35K Followers 2K Following Director Applied AI Lab & Perry Professor at UC, Author, Podcaster, Tableau Visionary Hall of Fame https://t.co/hOwQg4AtRS●https://t.co/Z8JTLTF9Uj●https://t.co/XYIW0lre98
Datajournalism Tools @DDJ_Tools
3K Followers 4K Following #OpenSource Tools: #datajournalism, investigative data-driven #journalism #DDJ, #dataviz, #datavis, Investigativer #Journalismus, #Datenjournalismus, #Recherche
DataViz Answers @DataVizAnswers
147 Followers 205 Following Tips and Tricks to make your data visualization successful. Ask good questions. Analyze all your data. Make your data beautiful!
Voilà: Francis Gagno... @chezVoila
3K Followers 904 Following Now on BlueSky | Information design studio focused on sustainable development. Since 2013. Gold @ Info is Beautiful Awards. Tweets by FG, founder.
InterWorks @interworks
6K Followers 4K Following A people-focused tech consultancy delivering premier service and expertise from #Tableau to #SnowflakeDB and everything in between. Find us around the globe!
Max Roser @MaxCRoser
276K Followers 1K Following Data to understand global problems and research to make progress against them. Founder of @OurWorldInData / Professor at @UniofOxford's @BlavatnikSchool
Your Current View @YourCurrentView
4K Followers 4K Following RTs of user current views. Take a picture and tweet it
UNGP Data Science @UNGPDataScience
897 Followers 291 Following @UNGlobalPulse is a United Nations innovation initiative exploring #BigData and real-time analytics. This is the account of the Data Science Team.
Open Data Zurich @OpenDataZurich
7K Followers 4K Following Hier twittert die Stadt #Zürich zum Thema #OpenData. Es schreiben M. Sieber ^sim & A. Güntert (gua) Nettiquette: https://t.co/3s2RNZz02w
dadaviz @dadaviz
2K Followers 264 Following We bring you the news the right way, visually. Forget about the words, we are all about the #data, so you are always in the loop. [email protected]

Matt Francis 💎 @Matt_Francis
9K Followers 985 Following Data Wrangler, Viz Creator, Podcaster, 2024 Tableau Social Ambassador, 2014,2015 Tableau Zen Master, Lover Not Fighter https://t.co/rghSyNwzfW
Plotly @plotlygraphs
42K Followers 8K Following Put data & AI into action by creating scalable, interactive data apps for your business with Dash.

Amanda Makulec MPH @abmakulec
7K Followers 2K Following #VizResponsibly. Writing, speaking & advocating for #dataviz for health and social good. Executive Director @datavizsociety. Mom & loss parent. She/her.
Ivón Guzman @IvonnGuzman
89 Followers 455 Following Mi pasión/Diseño Editorial https://t.co/D8gWrohM6s
Pitch Interactive @pitchinc
2K Followers 259 Following We are a multi-faceted data visualization studio focused on building meaningful experiences with data.
The Geekerie @theGeekerie
1K Followers 2K Following #Designer, #entrepreneur, #collectibles purveyor, #geek #nerd, workaholic, movie buff, #nostalgia addict, #gamer, and all around #awkward personality.
RAW Open Data @RAWopendata
103 Followers 362 Following RAW Open Data is a joint transnational event focused on Open Data
Infografias La Voz @InfosLaVoz
107 Followers 99 Following Muestra de trabajos que hacemos en la sección de infografías del diario La Voz del Interior de Córdoba, Argentina. Seguinos en fb, Infografías de La Voz
SportingCharts @sportingcharts
7K Followers 83 Following Changing the way people view sports statistics. Providing individual player and team charts and analysis for the NFL, NHL, MLB, and NBA
Big Data Combine @BigDataCombine
4K Followers 4K Following Rapid-fire, live tryouts for data scientists seeking to monetize their models as trading strategies.
VISU.AL @2bevisual
7K Followers 1K Following A new era , new age digital creative communications agency focused on growth . #strategy #creative #media #datadriven #getvisual #2bevisual #abetterway
World Bank Data @worldbankdata
81K Followers 406 Following The Development Data Group unlocks the value of #data for development. Follow us for #opendata news, stories & #dataviz. More: https://t.co/SYIZiT3mF6
Vox Maps @VoxMaps
14K Followers 37 Following Explaining the news with maps and analysis. Official account run by @voxdotcom.
Graphical Web @TheGraphicalWeb
1K Followers 2K Following World conference on open web graphics (SVG,webGL,CSS,video,Canvas,audio) +every input device. Nov 1-4 2016.
Datylon @datylon
600 Followers 872 Following Supercharge your chart design with fully customizable charts and advanced styling options, online and in Adobe Illustrator.
Mike Freeman @mf_viz
4K Followers 923 Following Data Visualization Software Engineer: working to make visualization more accessible, equitable, and impactful. Views are my own. He/him.
ddj.news @datajourn
427 Followers 323 Following https://t.co/HCY4359OTX features the best of the web for data journalists, to keep you inspired and productive. It's fun and it's free, so why not join now? (By @winnydejong)
Le Temps Data @LeTemps_Data
4K Followers 846 Following Le compte Twitter de l'équipe data et multimédia du quotidien suisse «Le Temps». Visual team of “Le Temps”
webkid @webk1d
1K Followers 0 Following We create data visualizations, customized tools and interactive maps that make your data easier to understand. Currently working on @reactflowdev.
GoogleTrends @GoogleTrends
530K Followers 7 Following Official Google data and visualizations from the Trends Data Team. Sign up for our daily newsletter at the Google Trends siteTrends for United States
You might like