Defender Trades @Tech__Defend
XRP • Elliott Waves • Cycles US Trade with me •https://t.co/y6MFcf48nC patreon.com/thedarksside The Netherlands Joined February 2020-
Tweets70
-
Followers1K
-
Following970
-
Likes0
💸

RIPPLE CASE IS OVER. RIPPLE WIN. #XRP WIN. WE WIN.
RIPPLE CASE IS OVER. RIPPLE WIN. #XRP WIN. WE WIN.
Elon's best meme involves a Bear...
Remember, we were expecting Sub-wave 1 when XRP was at $1 Weekly Wave 2 is complete when XRP closes above $1.56. Sub-Wave 3 Targets: $1.88, $4.10, $7.07. Sub-Wave 2 Supports: $1.37, $1.29 Enjoy your weekend.

We have been discussing in detail the possibility of expanding C Wave under the subject conditions since the first week of September. Wave 1 is complete, Wave 2 will be complete, and XRP will target Wave 3. Please see the subject post from 12 September below:
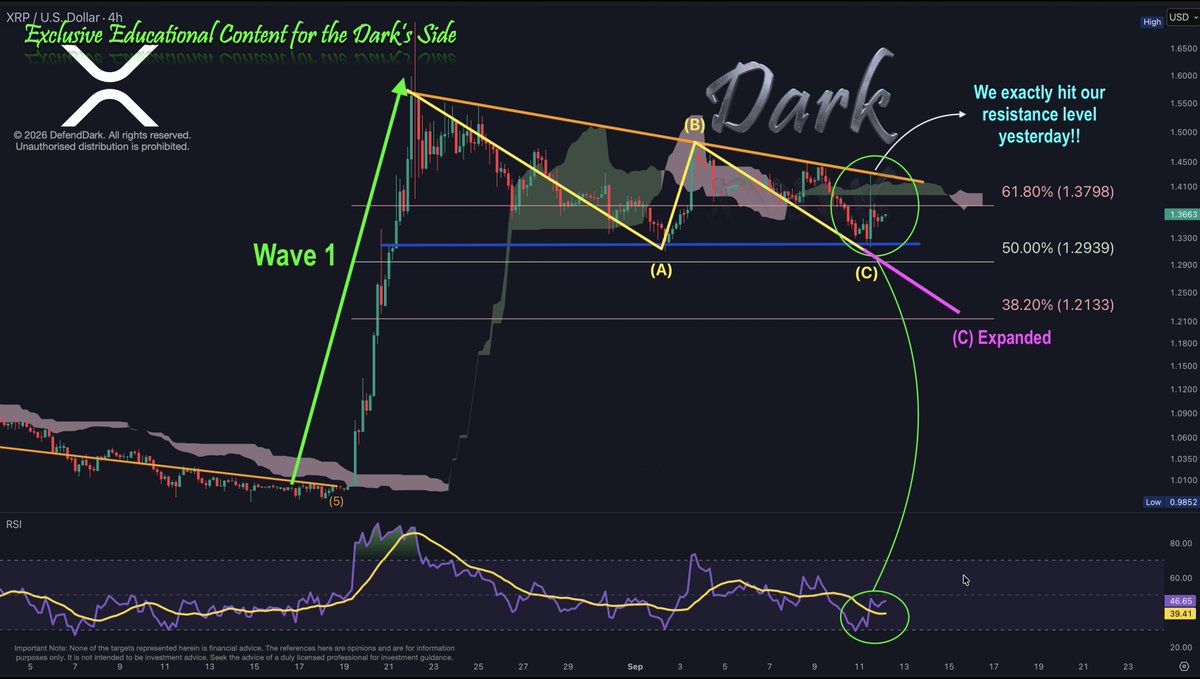
Here is our sample post from 12 September: (I shared the 4-hour chart above and will share 5-day time frame Chart below.) XRP Multi-Time Frame Update - ROAD to $10.1101 Hello there, my friends!!! I hope you are all well! Today, we combine the 4-Hour with the 5-Day so we can see the short-term noise within the higher-time-frame road. On the 4-Hour, the double tap did its job faster than expected. Price bounced off $1.33, ran straight up and hit our resistance level exactly- the orange line at $1.4445- and came back down. Yes, we hit it to the cent. A first attempt at a descending line rarely goes through, and this one did not, but it told us two things. You can see the moves were between our levels. Magic! The support at $1.33 is real, and the roof at $1.4445 is real. Price now sits between the two. So the orange line at $1.4445 is today's level. Let's check the detailed analysis with our Chart below: 4-Hour Time Frame: 1. Price is trading at $1.3663, under the 61.80% Fib level at $1.3798 and above our double tap support at $1.33. Yesterday's spike ran from the second tap into the orange line at $1.4445 and was rejected on the same candle on our orange resistance line, leaving a long upper wick. Since then the candles are small and sideways, holding the middle of the range between the support and the roof. 2. The structure: the count is unchanged, Wave 1 is the surge to $1.6992 and Wave 2 is the orange zigzag with the (A) and the (C) both on $1.33. The bounce from the second tap is the first attempt to leave the zigzag, and it stopped at the orange line, which is exactly where a first attempt stops. A close above $1.4445 breaks the line and confirms the (C) is done at $1.33. A close below $1.33 hands the leg to the pink part as the expanded (C) via $1.2939 to $1.2133, and above $1.5692 every C is cancelled. 3. The 4-Hour RSI reads 46.65, above the signal line at 39.41, so the cross we asked for yesterday has printed. From an oversold 37 on the second tap to 46.65 today, the momentum is back with the Bulls and the divergence has played out. A push above 50 with the price above $1.3798 adds weight to the reclaim. A fall back under 39.41 is the first warning that the bounce is fading. 4. The Ichimoku Cloud: price is under the thin green cloud between $1.37 and $1.41, and yesterday's spike went through the cloud and out the top before coming back. This indicator is bearish at the moment, and bullish again above $1.42. Counter: The $1.3433 level is touched, so the seal is broken. The spike closed above $1.3798 for one candle and gave it back the next, so no count is running. The new count opens with a close above $1.3798 that holds. 5. Support Zones: the 61.80% Fib level at $1.3798 as the first reclaim, the double tap at $1.33 with our counter level at $1.3433, the 50% Fib level at $1.2939, the 38.20% Fib level at $1.2133 as the expanded (C) target, then the 23.60% Fib level at $1.1204. Resistance Zones: the cloud top near $1.41, the orange line and the Key Level at $1.4445, the (B) top near $1.48, the start of the orange line at $1.5692, the $1.6992 high, then the PRIMARY at the 161.80% Fib level at $1.8815. 📷 6. Probabilities: 65/35 in favour of the Bulls while $1.33 holds and price is under $1.3798. A close back above $1.3798 restores 70/30. A close above $1.4445 that holds breaks the orange line and moves this to 75/25, and a close above $1.5692 cancels every C and takes this to 80/20. A close below $1.33 activates the expanded (C) and makes it 60/40 for that leg down to $1.2133. Only a close under $0.9852 breaks the count. In one line: the double tap bounced, the bounce hit the roof to the cent, and the range between $1.33 and $1.4445 is now the whole game. 5-Day Time Frame: 7. Price is trading at $1.3658, sitting right on the yellow line that capped every candle from the (4) down to the surge, and a hair under the 61.80% Fib level at $1.3798. The line that was the resistance for months is now the support under the current candle. 8. The structure: The surge to $1.6992 is the blue (1) of the new count. The blue (2) is drawn as a shallow dip toward the blue line, and everything we discuss on the 4-Hour, the double tap, the roof, the expanded (C), all fits inside this one (2). From there the road is (3) at the 361.80% Fib level at $7.0786, (4) back to the 261.80% Fib level at $4.1043, and (5) at the 427.20% Fib level at $10.1101, with the 361.80% Fib level at $18.2275 above it. The gate to all of it stays the PRIMARY at the 161.80% Fib level at $1.8815. 9. The 5-Day RSI reads 54.97, above the signal line at 42.29, and it is Bullish!!! 10. The Ichimoku Cloud: price is under the pink cloud, and the cloud bottom is at $1.42 with the cloud thinning ahead. This indicator is bearish at the moment, and the 5-Day close above $1.42 is where it turns. Above the cloud top, the 161.80% Fib level at $1.8815 is the next stop. Summary: 11. The market confirmed both of our lines in one day. The blue line at $1.33 held the second tap and the orange line at $1.4445 rejected the first attempt, so the 4-Hour is now boxed between a proven floor and a proven roof. The RSI has crossed its signal and is rising, which is what a bounce out of a Wave 2 low should show. Rejections at a descending line are normal, and what matters is whether the pullback holds above $1.3798 and $1.33 while the next attempt builds. As long as the higher low holds, the second attempt at the orange line is the trade the structure is pointing to. The Bears have the rejection wick at $1.4445, a cloud overhead and price still under $1.3798. The Bulls have the double tap, the RSI cross, and a bounce that already proved it can reach the line. We all know a roof is only a roof until it is a floor. The second attempt decides which one $1.4445 becomes. 12. On the news front, the spot XRP ETFs were flat on the day with the cumulative total holding at about $1.70 billion. The Senate cloture vote on the Clarity Act stays on 15 September! The floor held, the roof held, and the 5-Day already has the road drawn. Between $1.33 and $1.4445 the Bulls have the RSI and the Bears have the wick. The second attempt at $1.4445 is the one to watch. You can now generate passive income with Kraken (They enabled sub-affiliate programme for us) and I will share another post today on how you can do that!!! Enjoy your weekend!!! Dark "The key to everything is patience." Educational Purposes Only All content in this Discord-Patreon-X (posts, charts, videos, discussions) is for educational and informational purposes only. Nothing here is financial, investment, trading, or legal advice. No Personal Recommendations Analysis is general and does not consider your personal circumstances. I do not provide buy/sell/hold recommendations. Risks of Trading Cryptocurrencies are highly volatile and risky. Do your own research, consult a licensed adviser if needed, and never invest more than you can afford to lose. No Liability I am not a licensed financial adviser. You are fully responsible for your own trading and investment decisions. Community Requests Responses to requests follow the same rule: general technical analysis only, not tailored advice.

Last Chance.
XRP dropped from $1.96 to $0.20, and I haven't experienced this much fanfare at that time. XRPArmy experienced worse days together. I was there. Now, the newbies made me laugh. We know what we have. We know the targets. As David says, haters gonna hate. If you hate XRP, just stay away. Simple.
Yes, the time is up. XRP broke out of the triangle. I know this 8-cent drop is frustrating for some of you, but this is normal. We said the 3rd Wave would continue with candles closing above $1.5692. Supports are: $1.445, $1.3798 Targets: No Change. (not financial advice)

XRP is at $1.52 & expected to break out of this triangle in 24 hours. (Not financial advice)

I warned that a breakout is incoming in 24h. And it arrived. People who say, "Yeah, it broke downside", are unable to read what was written. Hilarious.
#XRP is very close to the Gate, $1.5692. Once it breaks the yellow resistance, it can move at light speed.
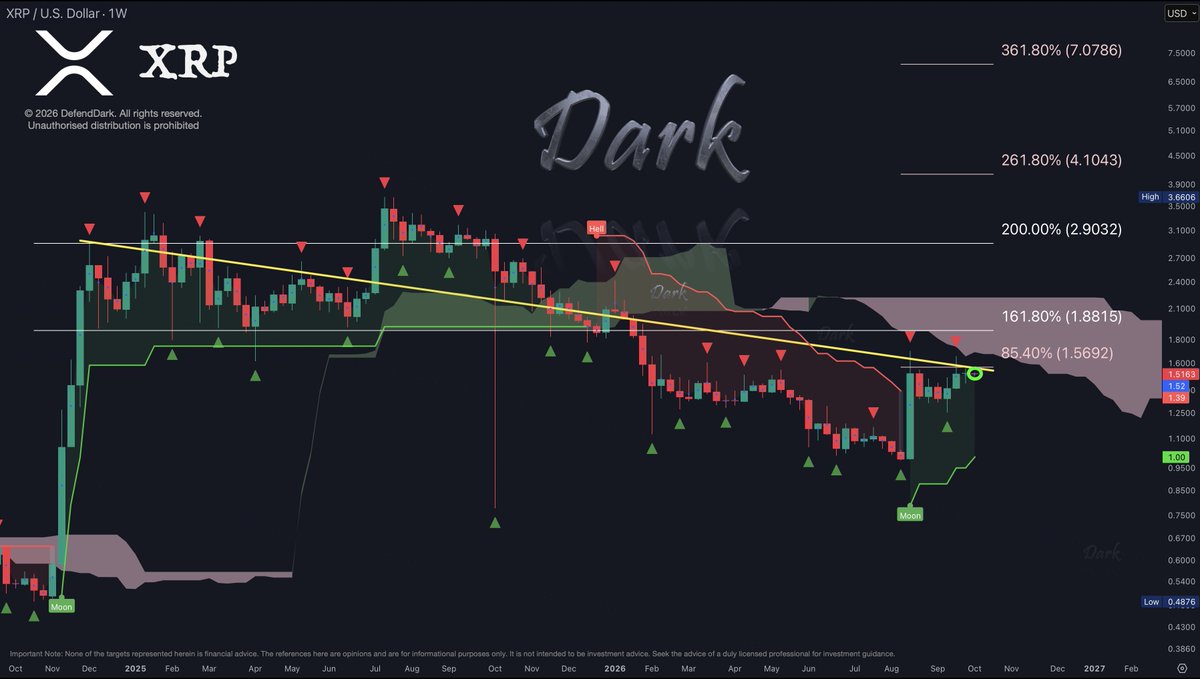
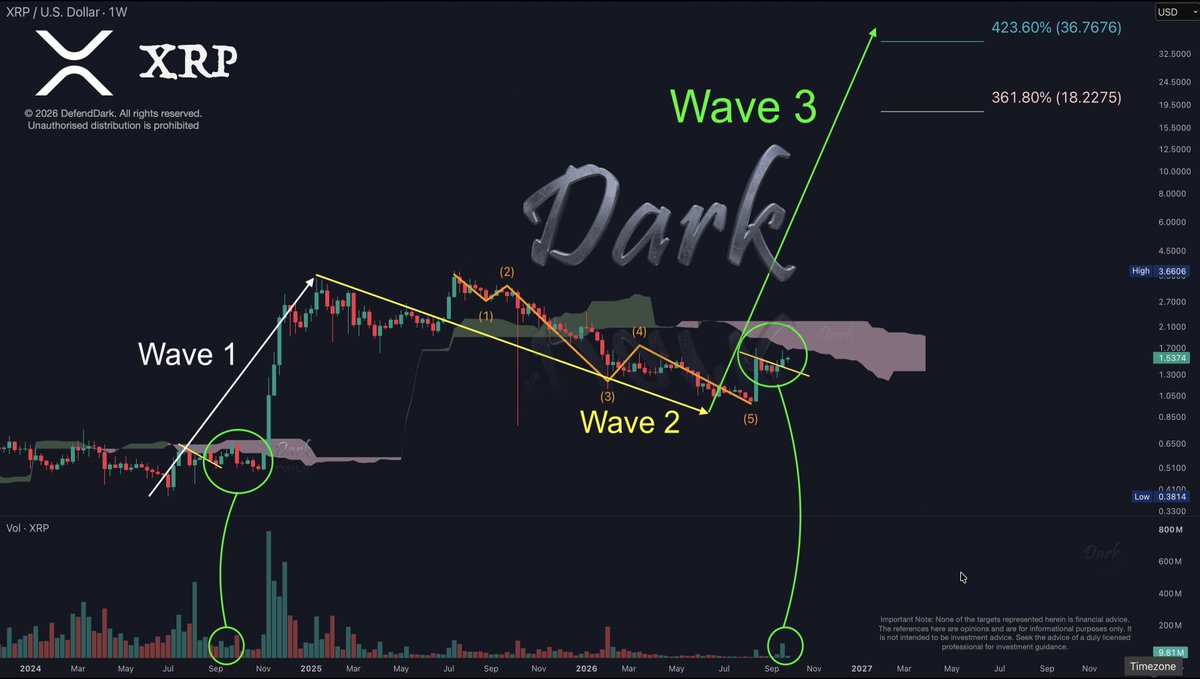
The Roadmap to $36.76 on the weekly time frame. XRP completed Blue Wave 1 and is now in Wave 2. The historical pattern shows a sideways phase here, and the Wave 3 window is already starting to line up with it. The initial surge can be expected towards $4.10 and then $7.07. And then Suddenly :) Happy Sunday. (Not Financial Advice)
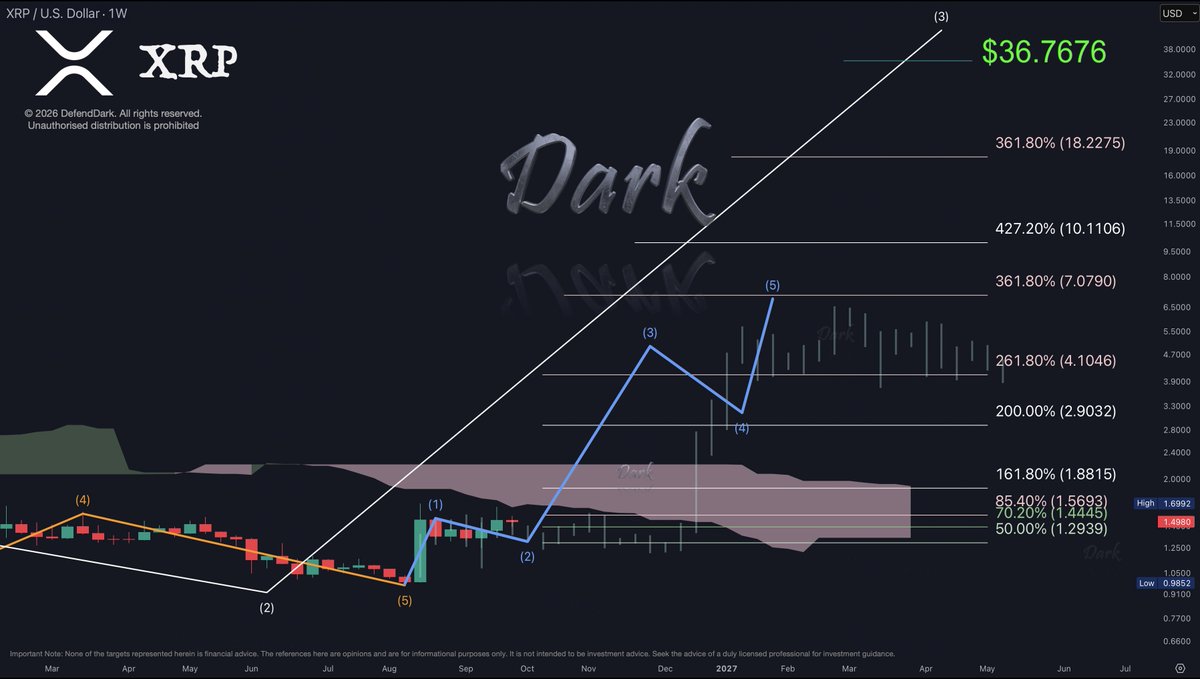
For those who like details: patreon.com/thedarksside/p…
#XRP respected our support & resistance levels this week 🎯 This is a Bullish Break, and we can expect the Surge any time now. (not financial advice)
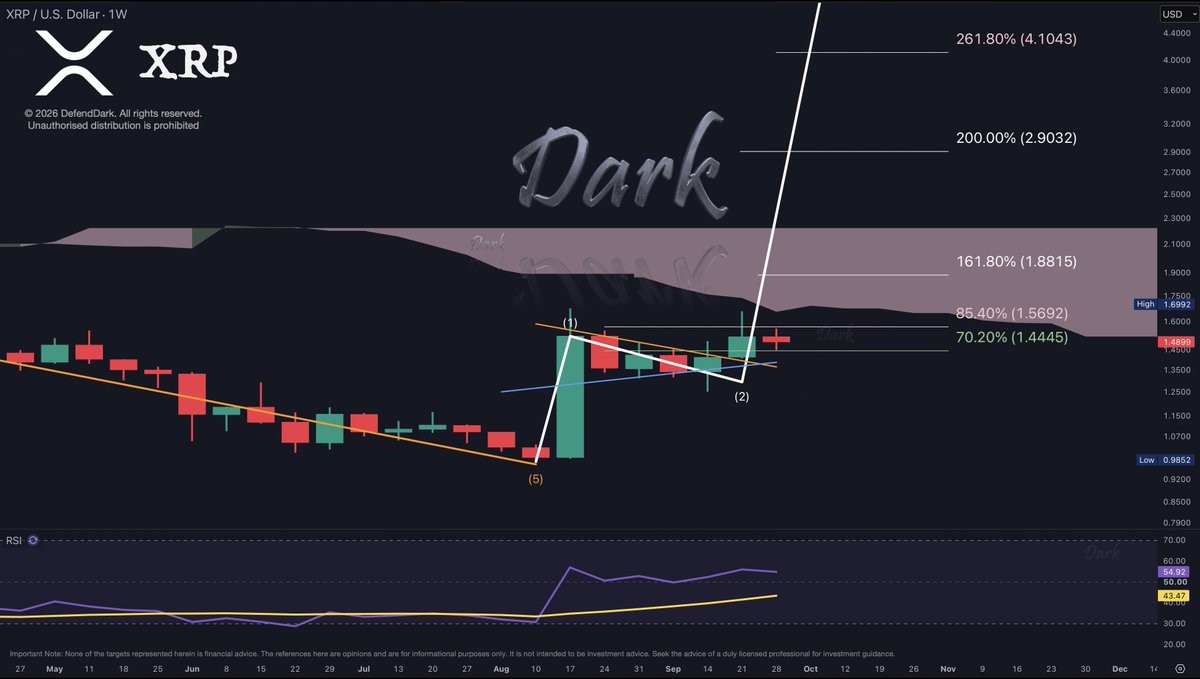
Ladies and gentlemen, and dear children: Flight X589 departed at $0.98 & reached Wave 1 at $1.70 in eight days. We had a little turbulence through Wave 2 Kumo Clouds. Passengers on the left can see the runway is behind us. We are now climbing with Wave 3. Please remain seated and enjoy your flight! (not financial advice; my thoughts only)
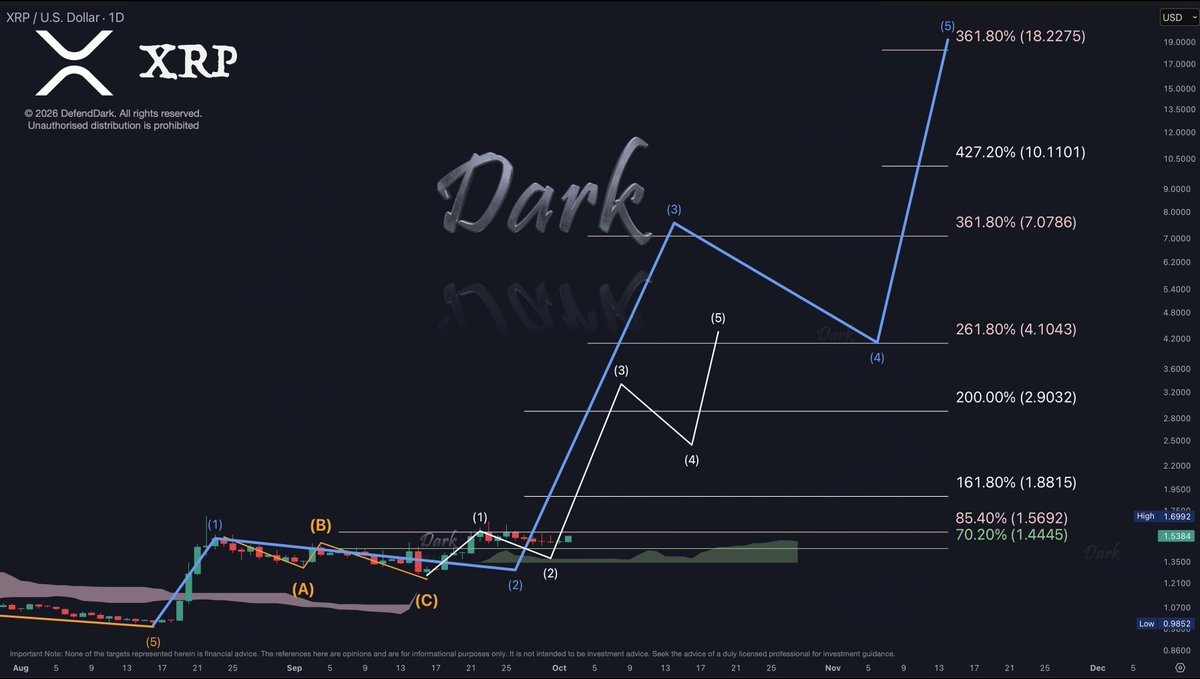
Remember: If the daily candle closes above $1.5692, XRP quickly expands the move toward $2.90 & $4.11 We will have an update soon. (not financial advice)
If the daily candle closes above $1.5692, XRP quickly expands the move toward $2.90 & $4.11 ⁽ⁿᵒᵗ ᶠⁱⁿᵃⁿᶜⁱᵃˡ ᵃᵈᵛⁱᶜᵉ ᵇᵘᵗ ʲᵘˢᵗ ᵐʸ ᵗʰᵒᵘᵍʰᵗˢ ᵒⁿˡʸ⁾
In the blink of an I.
Do not get distracted by the smaller time frames. #XRP closed the monthly candle by breaking the year-long resistance trend. Question: Was it a bearish or bullish breakout? Dark: Rotate, positive rate, gear up. (not financial advice; my thoughts only)
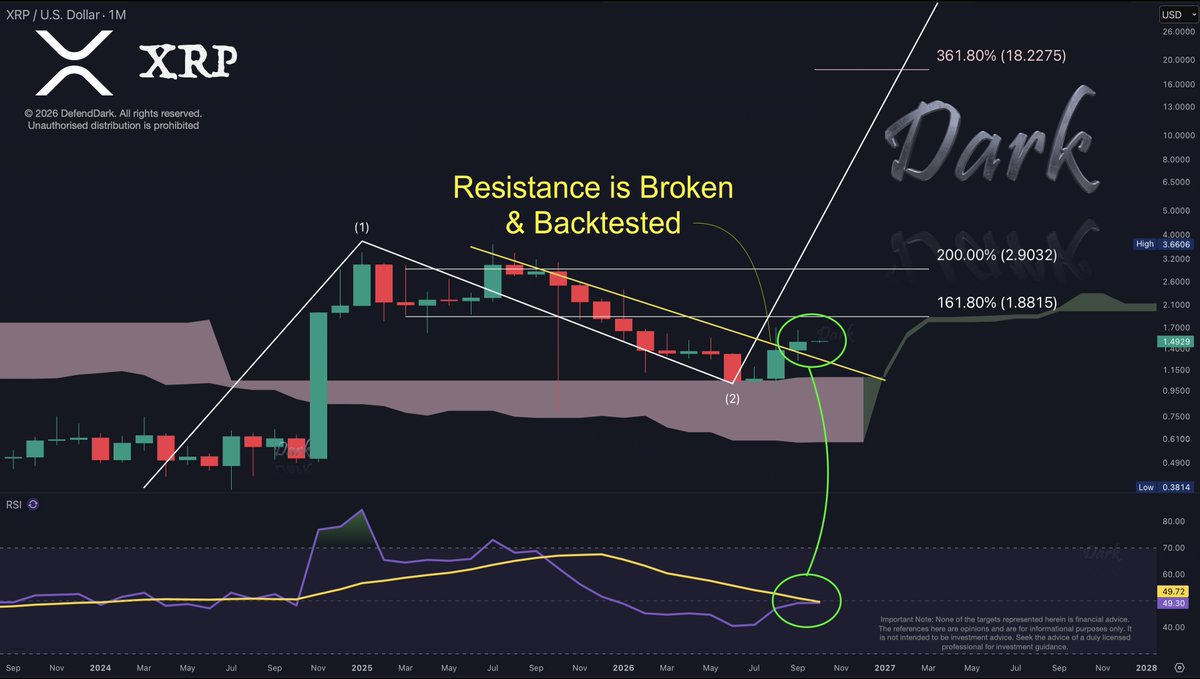
On 3-Aug-2024, we calculated the Wave 1 top at $3.3939. It printed. Wave 3 is next, targeting $36. Volume is building the same way it did before Wave 1. The bell for XRP rings at Nasdaq soon. (not financial advice, just my thoughts)


فرز جميله �... @eFkFkwWgQxZStL7
168 Followers 205 Following
Give me a follow back... @Mabeltanaelmar1
218 Followers 251 Following
GIVE ME A FOLLOW BACK... @k_prapha
176 Followers 289 Following U.S. Attorney and Sr. Advisor to the Attorney General

فرز كارما �... @mohdkai34863875
133 Followers 318 Following
GIVE A FOLLOW BACK AL... @Nada78339421
104 Followers 186 Following
Mars Pioneer @MarsPioneer7q
96 Followers 274 Following CEO-SpaceX 🚀Tesla car🚘 ICEO-X CO- FOUNDER- Neuralink; Open Ai 🤖 Dedicated to Elon Musk's vision for a better future Discussing SpaceX, Tesla


liam fedders @liamfedders
171 Followers 382 Following

kindly give me a foll... @Opall58787848
202 Followers 289 Following ENTREPRENEUR, INNOVATOR, SPACE X 🚀 ENTHUSIAST.CO- FOUNDER OF TESLA MOTORS.🚘
8❣️ @mami81959214
156 Followers 367 Following
lmam @lmam_hussain
127 Followers 364 Following
فرز شهد 🔥�... @NikkiSifford
187 Followers 531 Following
GIVE ME A FOLLOWBACK ... @But_sakron
206 Followers 436 Following
فرز روز @Aewaew09919268
152 Followers 350 Following
𝓛𝓾𝓷𝓪 🌙 @Limahurtado1
153 Followers 365 Following
Chloe chubbs 🍩🤤 @2539Mami
187 Followers 179 Following BBW gainer ,Living for good food, good vibes, and someone who loves watching me enjoy both ,come spoil me ...🤤

ليلي🎀 @kristi_stell
139 Followers 416 Following
kindly give ne a foll... @kindlygivechfq
176 Followers 451 Following

Commentary reeve X @AdamIdha1
214 Followers 490 Following

GIVE ME A FOLLOW BACK... @game_daraza
188 Followers 361 Following
Give me a follow back... @N9PWsixsWimCH3a
162 Followers 164 Following
may @Kardo03419143
136 Followers 352 Following
𝓢𝓸𝓹𝓱𝓲�... @MesterBlack2
145 Followers 373 Following
hazlina @hazlinarzali
135 Followers 377 Following Allah yuftah alaikum semua. Our plan is big but Allah's plan is bigger. Leave everything to Allah.
GIVE ME A FOLLOW BACK... @bggfu98990
178 Followers 450 Following
娱乐地图🍑🍑�... @007Roy69
774 Followers 911 Following 🏙️【海选实体会所】🏙️⬇️⬇️进主页看联系方式⬇️⬇️🍑🍑💗限时不限次💗,日常在店20➕位模特,新客不上门。【互玩互舔】【莞式服务】【丝袜诱惑】【制服诱惑】【情景演绎】等应有应有。🈚️套路,🈚️定金🟨
Pëtitẽ Vixěñ🔥... @vixenpetite59pv
201 Followers 364 Following
ISlam @TousifIstiak
131 Followers 350 Following

Hawaiiantobe @Hawaiiantobe
131 Followers 346 Following
GIVE ME A FOLLOWBACK ... @MiltonicMilton4
342 Followers 370 Following U.S. Attorney and Sr. Advisor to the Attorney General's
mare Dakar 3 @shadhin_kumar
164 Followers 380 Following
娱乐地图🍑🍑�... @FallenAngel_frv
769 Followers 924 Following 🏙️【海选实体会所】🏙️⬇️⬇️进主页看联系方式⬇️⬇️🍑🍑 💗限时不限次💗,日常在店20➕位模特,新客不上门。【互玩互舔】【莞式服务】【丝袜诱惑】【制服诱惑】【情景演绎】等应有应有。🈚️套路,🈚️定金🟨
9❣️ @Miuw49910626
184 Followers 484 Following
٧🍂 @mel92859494
120 Followers 376 Following
娱乐地图🍑🍑�... @NailmaroNailma
799 Followers 915 Following 🏙️【海选实体会所】🏙️⬇️⬇️进主页看联系方式⬇️⬇️🍑🍑 💗限时不限次💗,日常在店20➕位模特,新客不上门。【互玩互舔】【莞式服务】【丝袜诱惑】【制服诱惑】【情景演绎】等应有应有。🈚️套路,🈚️定金🟨
Tesla X @Tesla_X091
153 Followers 465 Following electric vehicles and the future of sustainable future🚀❤️
Give me a follow back... @shaikhs31748535
265 Followers 496 Following
🏠🌹⁹ @Cagdasakkaya3
330 Followers 248 Following
Tammy @_tammytambam
313 Followers 265 Following

𝓔𝓶𝔂 @emrah58972308
322 Followers 256 Following
omnia @ozge__torlak
326 Followers 251 Following
تولين @BeammiieK
377 Followers 321 Following
🏠🌹⁴ @AAli60256822
322 Followers 269 Following
bahozhamza2147 @MehmetEminEken1
310 Followers 239 Following
angel claira @ltakfi
316 Followers 282 Following good chats get my attention 🤍 • dms on, test them — i reply
🏠🌹⁶ @UgurmehB_8
320 Followers 265 Following
Chris101 @Chris1035645004
313 Followers 280 Following
gogo @KingMalik75
317 Followers 264 Following 7年老牌鲜花配送经验、一二线和海外城市配送、永久门槛可抵扣、我对花很挑 现在ai和丑🌹太多 只选好的给客户 没有套路 每天精选 好花更新 ✈️链接点不进去 就返回再点一次 https://t.co/06p2QQLbjz
mai @Brandonkirby35
318 Followers 409 Following 7年老牌鲜花配送经验、一二线和海外城市配送、永久门槛可抵扣、我对花很挑 现在ai和丑🌹太多 只选好的给客户 没有套路 每天精选 好花更新 ✈️链接点不进去 就返回再点一次 https://t.co/98SwJr6PPt
Trash panda @Trashpa40176065
319 Followers 250 Following
meu @letzaynkiss
3K Followers 2K Following
✿✿ @nooon20900
3K Followers 2K Following
eduardo nicolas @eduardo65610641
3K Followers 2K Following
Speed Touch @touch_speed
3K Followers 1K Following
jerry ruber @ruber_jerry
3K Followers 2K Following
jojo @jojo19914207
3K Followers 2K Following
Joshua axel @AxelJosua2301
3K Followers 2K Following

Spongebob @Spongbob_Feiten
2K Followers 954 Following Ik ben Spongebob en ik ga je TL vol spammen met feiten over mij :D


୨୧ لينا ୨�... @talalxxxx2
2K Followers 1K Following
𝚁𝚊𝚠𝚊𝚗 @AlperAra
2K Followers 738 Following
𓆩𝐁𝐋𝐀𝐂�... @batuhan6787
2K Followers 2K Following
ZₑZₒ @Brunavi83649902
2K Followers 2K Following
𝔍𝔬𝔬 @mydefne29
2K Followers 2K Following
Tymek @Tymek5059012143
6 Followers 9 Following
Dale Pinkney @DPinkney58106
177 Followers 1K Following
M-G @Greenmo20259333
8 Followers 19 Following

MBerg @1987Jarhead
62 Followers 82 Following
PLAN A @ahmdwnd208975
265 Followers 887 Following
glenn @gbvetracer025
251 Followers 36 Following

wonderfulcindy @iseungmi11
35 Followers 106 Following
M SUMARNA HAKIKI @HakikiSumarna
133 Followers 311 Following
napul @napul_beach502
189 Followers 41 Following
Sumair Ali @Sumairalirind11
27 Followers 294 Following
Pranav Bhandari @PranavBhandari6
505 Followers 6K Following
Austin Boccaccio @MasterAuggie
390 Followers 596 Following
toriswynn @toriwynn82
374 Followers 1K Following
Bart fiore @Bartfiore289901
25 Followers 31 Following
Ab @Ab_ab_ab19
20 Followers 34 FollowingYou might like