Search results for #ggplot

Analysis of New York City Real Estate Listings This was done on #Rprogramming with the help of #ggplot, #tidyverse, #GoogleMaps and more. isabelcabrerar.wordpress.com/2025/09/15/ana… #DataAnalytics #dataanalysis

Presenting this data only as the relative ranking of values overestimates the differences between groups! Hope you don't mind, @SteveKornacki - grabbed the data from your post and popped into #ggplot to paint a fuller picture.
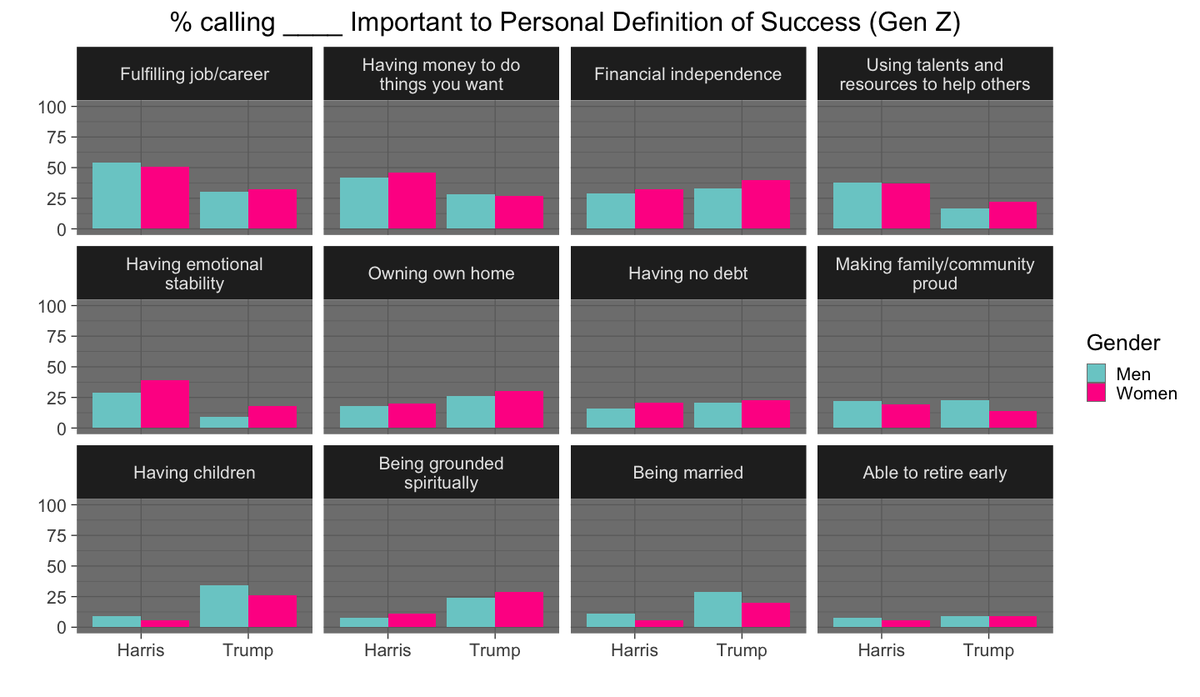
Presenting this data only as the relative ranking of values overestimates the differences between groups! Hope you don't mind, @SteveKornacki - grabbed the data from your post and popped into #ggplot to paint a fuller picture. https://t.co/7RhuYmJprj


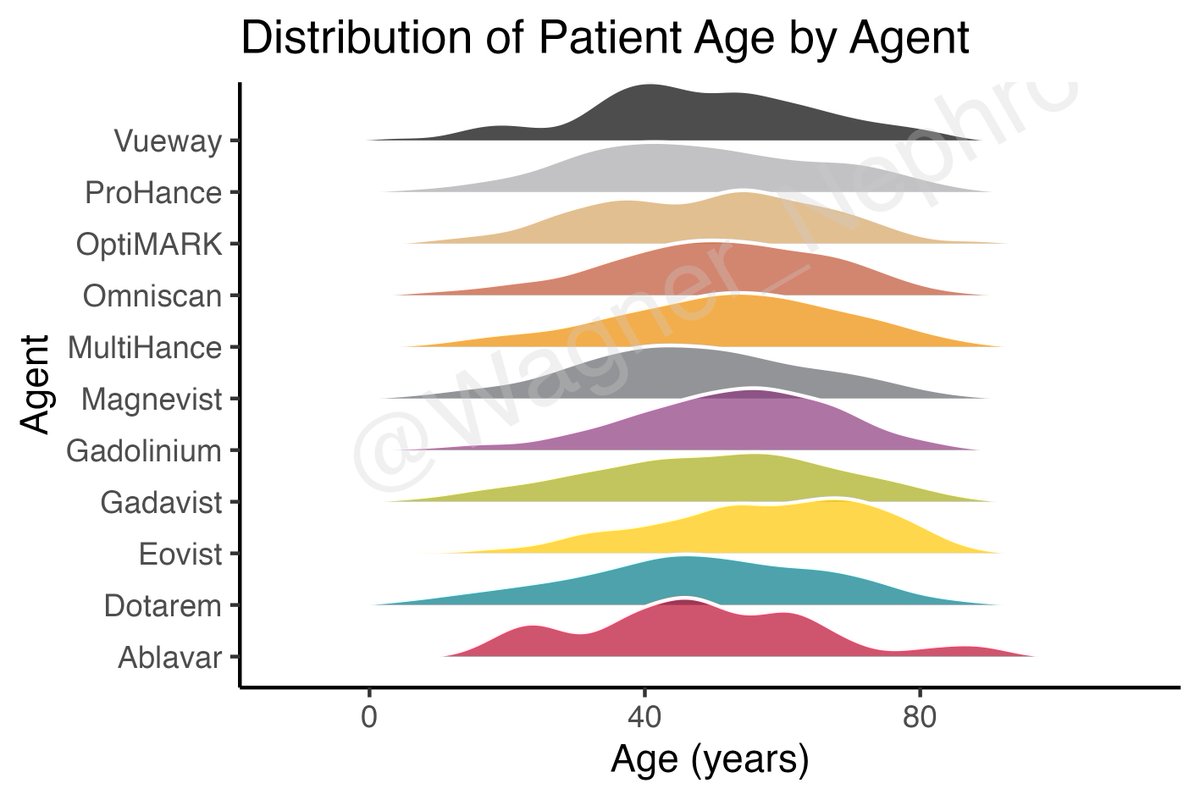
MRI contrast agents and reported adverse events from FAERS (duplicates removed). Age trends visualized with #ggplot ridge plots. #Rstats #pharmacovigilance #FDA


I use #ggplot #gganimate #Rstats to visualize spatiotemporal trends in public ICE detention data Watch ICE detention increase over time: more detainees (bigger dots), more non-criminals (blue → red), and more jails popping up inland in 2025 Code #gist: gist.github.com/JEFworks/899a1…

New content to my recently launched course: "Healthcare IT Decoded – Data Visualization using R"! Reuse your ggplot2-based R code in Python Enroll using the discounted link valid till 05/15/2025 6:00 PM IST udemy.com/course/healthc… #datavisualization #Python #ggplot #plotnine


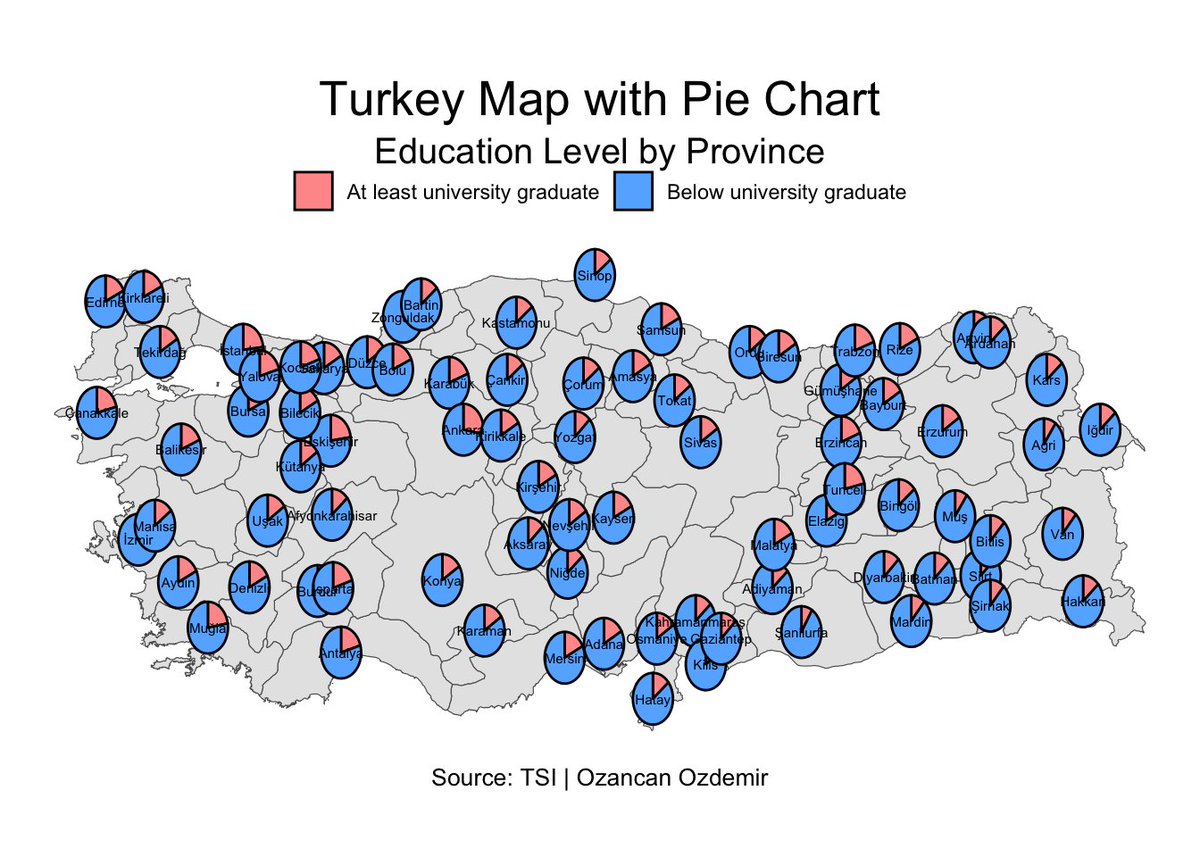
R programlama dilinde, haritaların üzerine pasta grafiklerini nasıl ekleyebileceğinizi gösteren bir öğretici hazırladım. #Rstats #dataviz #ggplot ozancanozdemir.github.io/map_and_piecha…


Sotero Salazar Ana Ka... @ggplot2_lech
54 Followers 3 Following
ggplot2 @ggplot22
13 Followers 0 Following
ggplot2 @ggplot23
3 Followers 1 Following
ggplot2 @ggplot2
117 Followers 14 Following
Gabrielle Doran @ggplot_gabby
15 Followers 23 Following i'm not like a regular nerd, i'm a cool nerd #datascience #statistics #r #sql #python
Ana Karen Sotero Sala... @ggplot_lech
8 Followers 3 Following
George Garcia III @ggplot_3
31 Followers 82 Following First gen PhD student in economics @MIT, interested in culture, political economy, and inequality
GG @ggplot_20121
19 Followers 185 Following
GgplotR @GgplotR
3 Followers 6 Following
Ray Carpenter @csv_enjoyer
324 Followers 420 Following In the data mines. Painting happy little accidents with matplotlib, plotly, circilize, d3 and ggplot here and at The Spade on Substack below

ggplot2 @ggplot25
6 Followers 147 Following
qibin guo @ggplot_1
0 Followers 0 Following
ggplot1 @ggplot111
0 Followers 0 Following
ggplot @ggplot8
0 Followers 0 Following
ggplot @ggplot5
0 Followers 0 Following
GGPlotDontLie @GGPlotDontLie
0 Followers 0 Following
GGPlot Bot @GgplotB
0 Followers 0 Following

ggplot @ggplot13575y
0 Followers 1 Following
Ggplot @Ggplot6
0 Followers 1 Following
ggplot @ggplot19
0 Followers 1 Following
ggplot30 @ggplot3084394
0 Followers 1 Following
정동철 @ggplot
3 Followers 32 Following
g gp lo t @ggplot117033
0 Followers 2 Following
해석 손 @ggplot9799
0 Followers 2 Following
abu s @ggplot82
0 Followers 2 Following
ggfdrr @ggplot18rr
0 Followers 2 Following
ggplot_40 @40Ggplot84088
0 Followers 2 Following
Gretchen Kioschos @ggplot00
2 Followers 50 Following
ggplot @ggplot79716935
0 Followers 3 Following
ggplot @KunYi50071
0 Followers 3 Following
Inès @ggplot99
0 Followers 4 Following
임정 @ggplot_belle
0 Followers 4 Following

Ggplot @Ggplot226
0 Followers 5 Following
ggplot @ggplot7
0 Followers 6 Following
ggplot @lnlo_ln1
0 Followers 7 Following
Ggplot @Ggplot13351
0 Followers 9 Following

c l @ggplot222
0 Followers 55 Following
郑泽生 @ggplot21
0 Followers 58 Following