
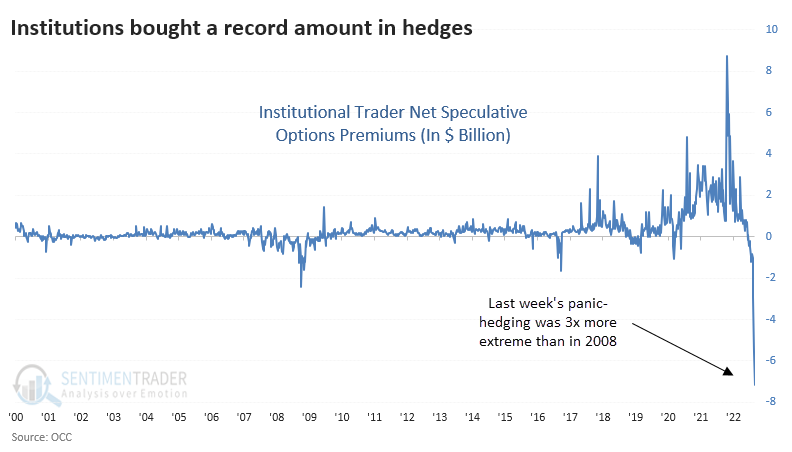
Sometimes, there's a chart that just blows your hair back. In 22 years of doing this, none stand out like this one. Last week, institutional traders bought $8.1 billion worth of put options. They bought less than $1 billion in calls. This is 3x more extreme than 2008.

@sentimentrader I don't think this has much information value. You can also say that institutions sold record amount of put options last week. It's a zero sum game. For every option seller, there is an option buyer. You can equally draw conclusion that institutions are extremely bullish now!

@sentimentrader you do good/interesting work so i'm surprised you don't normalize that metric by equity market cap. below is R3000 market cap over time...$10t in 2008 vs $41t today...so 3x the notional size in hedges isn't extreme anymore. $8b in puts aint what it used to be


@sentimentrader @SeldonOnMarkets Or $8.1 Billion worth of Put Options were "Sold". 3 times more than 2008. In a derivative market, seller comes first, and then the buyers. Not trying to predict anything, just letting you know there are several ways to interpret a chart.


@sentimentrader @JCOviedo6 In fairness the market is at least 4x as big today, so as a pct of mkt cap today’s # is smaller

@sentimentrader @JackFarley96 Put options on what? Equity?


@sentimentrader When new traders don't know that selling puts is actually bullish... and that the markets market cap is more than 3x larger than it was in 08. Sigh...