
If we compare daily cases to prevalence we see an interesting result, where there is a consistent relationship in 2020 and most of 2021 (blue and yellow points), and a shift in 2022 to a steeper relationship where fewer cases correspond to greater prevalence (red points). 7/16

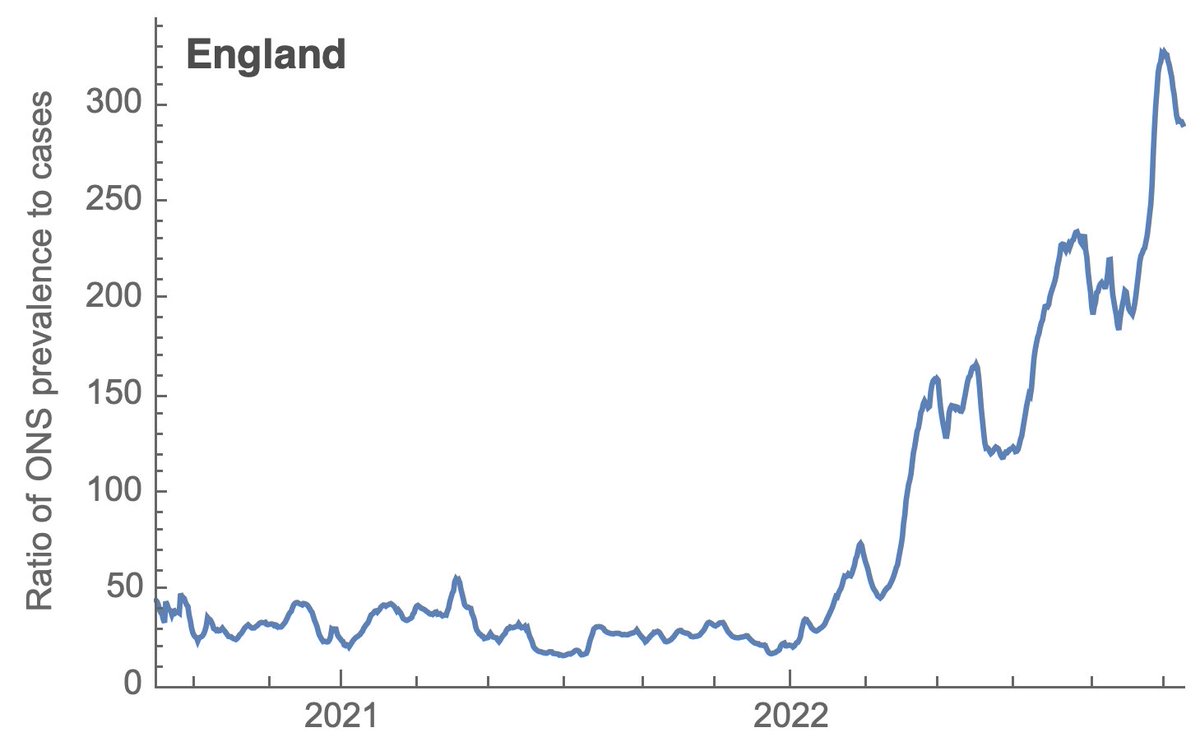
If we take a ratio of ONS prevalence to daily incidence, we get the following where the ratio is fairly constant at ~30-fold throughout 2020 and 2021, but increases sharply throughout 2022 and is now perhaps ~300-fold. 8/16
The 30-fold ratio can be converted into case detection rate by dividing by the span of time during which the average infection tests positive. I'll use 10-days for the pre-Omicron period (nejm.org/doi/full/10.10…). This gives a detection rate of 1 case per ~3 infections. 9/16
Likewise, the current 300-fold ratio can be converted assuming the average infection tests positive for 8-days in 2022 (medrxiv.org/content/10.110…). This would imply a current case detection rate of 1 case per ~38 infections. 10/16
Unfortunately, I'm not sure how best to extrapolate this number to the US, as I believe that testing has declined more in the UK than in the US. However, the ~10-fold difference between a year ago and today is absolutely striking and may suggest a roughly similar decline. 11/16
This said, the silver lining here (for what it's worth) is that if there are now many more infections per case it means that looking at the ratio of cases to deaths is not easily comparable to earlier in 2020 or 2021. 12/16
Using the above ratio of ONS prevalence to daily per-capita cases along with a 10 day testing positive duration we can estimate new daily per capita infections in England as the following. 13/16
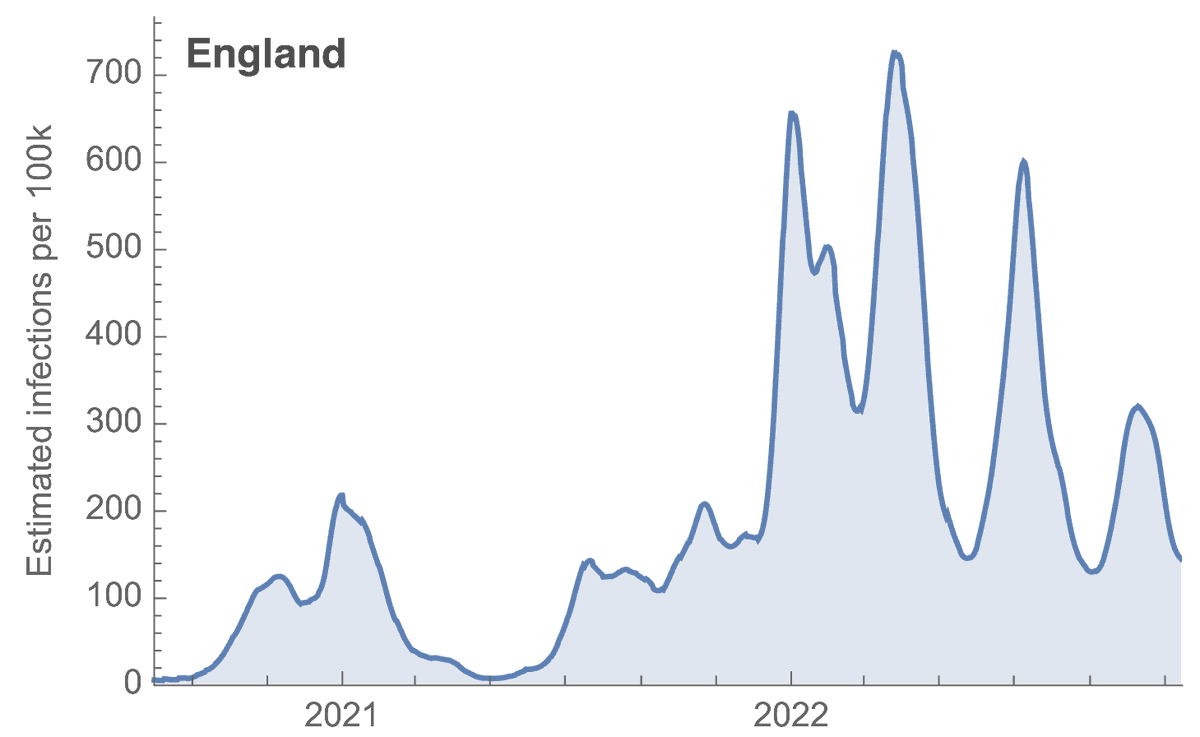
If we sum the number of infections in England from June 1 to present we get an estimate of 25.8M or 46% of the population infected. During this time, there were 17,514 deaths within 30 days of confirmed COVID infection. 14/16
This would imply a crude infection to fatality rate (IFR) of 17514/25.8M = 0.07% or 1 death in ~1500 infections, which fits with broad expectation for current IFR. If instead we use deaths with COVID on death certificate we get an IFR of 0.04%. 15/16
We have a situation of continued substantial circulation, but with per infection risk of death similar to influenza. Though this is not accounting for long COVID which alongside greater circulation places health burden of COVID substantially higher than influenza. 16/16

@trvrb Interestingly, Robert Koch Institut in Germany is currently estimating a cases to infections ratio of ca of 1:3 which seems unfathomably low esp. given the average PCR positivity rate of ~30%.
@ExperienceHe That definitely seems odd. Do you have a link to their report handy?