Ingenium Analytics | André Bakhos @IngeniumMkts
Institutional Technical Strategist | Market Structure, Breadth, Relative Strength & Risk | Managing Member, Ingenium Analytics | 40+ Years on Wall Street ingeniumanalytics.com New Jersey, United States Joined September 2022-
Tweets31
-
Followers26
-
Following217
-
Likes21
When the Chart Disagrees With Itself A constructive pattern can form while the evidence beneath it is deteriorating. Momentum may be fading, breadth narrowing, and divergences developing even while price still looks intact. That does not automatically invalidate the pattern. It changes how much risk should be committed to it. The pattern identifies the opportunity. The supporting evidence determines its quality. If the structure triggers while the internals remain conflicted, partial exposure may be appropriate. If price follows through and the internals improve, add. If price fails while divergences deepen, the conflict itself becomes the message. Price gets the vote. Indicators set the risk budget. Divergence tells us when that vote deserves closer scrutiny. #TechnicalAnalysis #MarketStrategy #RiskManagement #IngeniumAnalytics

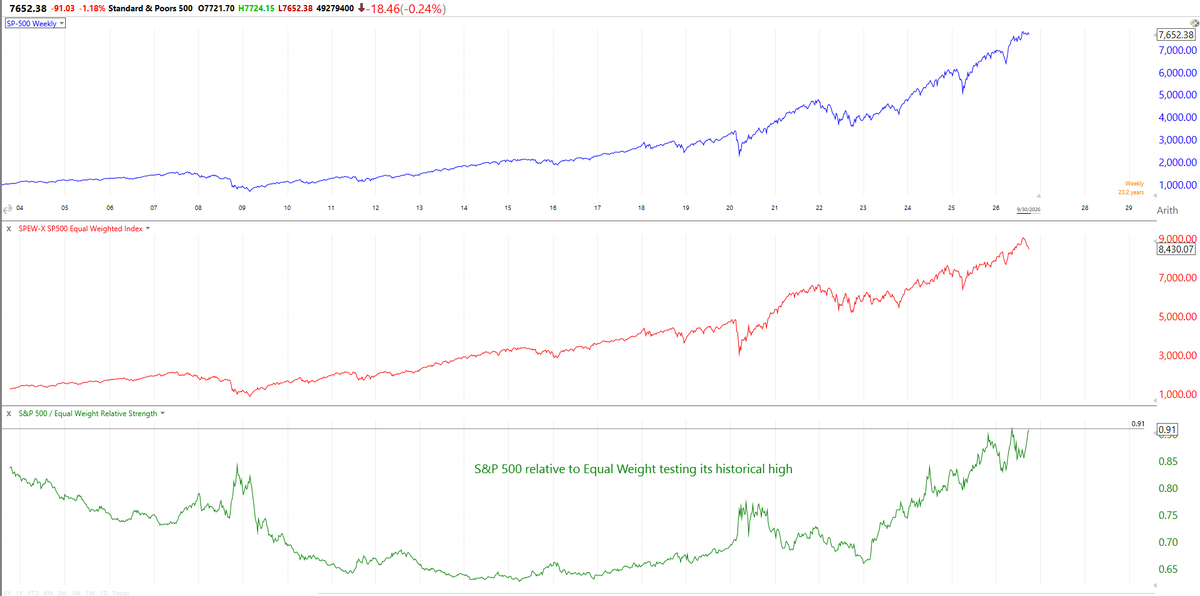
The S&P 500 versus Equal Weight ratio is testing the highest level in more than 23 years of live Equal Weight history. The capitalization-weighted index has rarely been this dominant. This is an extraordinary measure of concentrated leadership: the index continues to advance, but an increasingly disproportionate share of that performance is coming from its largest constituents, confirming what many traditional breadth measures and our own Breadth Engine work have been showing. By itself, however, this is not a bearish signal. Concentration is a condition, not a timing tool, and these regimes can persist for extended periods. The significance is that a progressively narrower group of stocks is driving headline index strength. $SPX #SP500 #MarketBreadth #TechnicalAnalysis #Stocks
Weak breadth is no secret. Our Bull Breadth Engine currently registers just 77 names. Of those: XLK: 30 XLV: 22 That means Technology and Health Care account for 52 of 77 Bull names — roughly 68%. In many respects, we have three markets right now: the S&P 500, Technology, and Health Care. The negative divergence remains. Tread carefully.
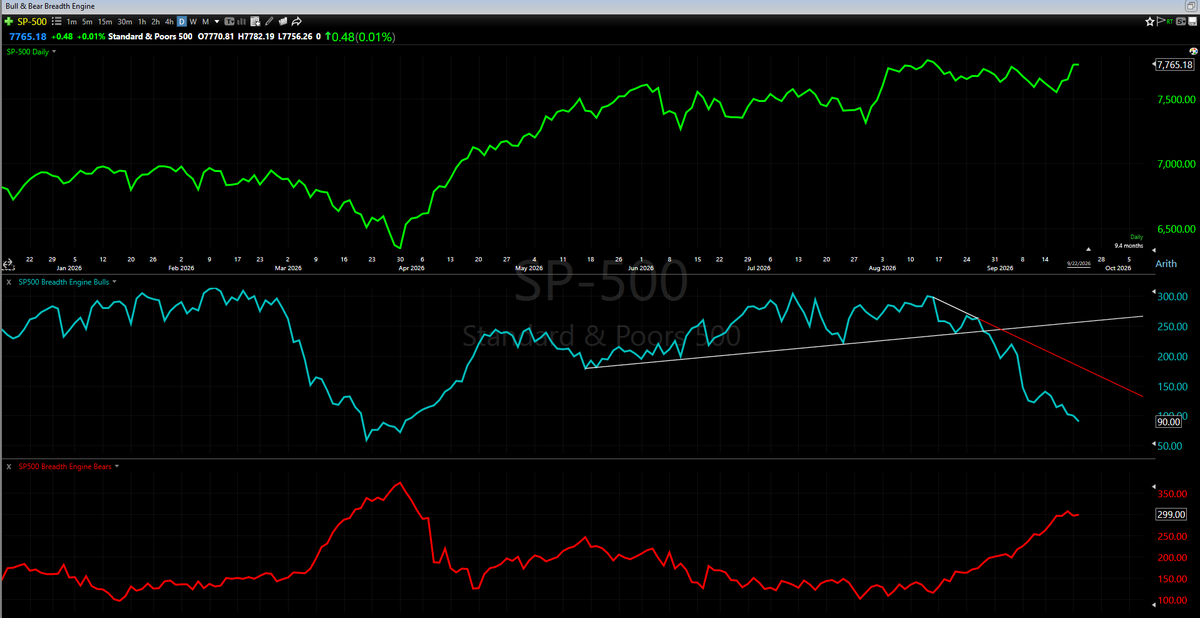
The market continues to defy its own internals. Our SPX Bull & Bear Breadth Engine now shows: Bears: 299 Bulls: 90 In late March, Bulls reached roughly 59 while Bears peaked near 374, around the market low. This time, we have seen nothing resembling that kind of price damage. The market remains near its highs even as participation continues to narrow. The equal-weight S&P 500 reinforces the message, telling a very different story from the cap-weighted index. Negative breadth divergence is a warning condition, not a timing signal. Price can continue higher, the internals can repair through time or broader participation, or price can eventually adjust lower to reflect the weakness already visible beneath the surface. For now: Price remains resilient. Breadth remains weak. The divergence remains unresolved. #SPX #SP500 #TechnicalAnalysis #MarketBreadth #MarketInternals
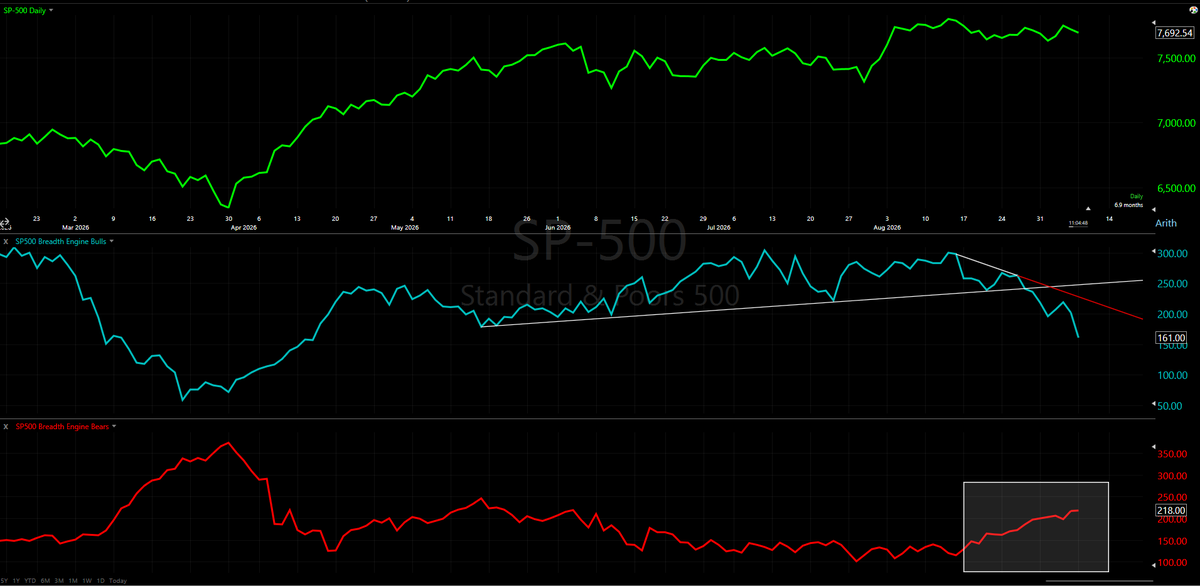
The deterioration in our Bull & Bear Breadth Engine has continued to deepen, yet the S&P 500 remains remarkably resilient near the highs. Bull breadth is weakening. Bear breadth is building. Price, so far, refuses to break. That leaves the market at an increasingly important inflection point: will the index finally resolve the divergence with an accelerated move lower, or will price hold long enough for breadth to recover and repair the damage? For now, the standoff continues. The index is holding. The internals are not. One of them will eventually give way. #TechnicalAnalysis #MarketBreadth #SP500 #MarketInternals #RiskManagement #IngeniumAnalytics
The market has a way of exposing what a trader truly wants, not merely what he says he wants. Discipline seeks returns. Ego often seeks validation. #Trading #Markets #BehavioralFinance #TradingPsychology #RiskManagement #EdSeykota

We see clear signs warranting attention from our Bull & Bear Breadth Engine. The S&P 500 remains near all-time highs, while erosion is creeping into the Bull factor in light blue and the Bear factor is beginning to accelerate in red. The recent negative divergence suggests that some weakness may be in the offing. Whether this is simply a seasonal exposure-reducing phase or the beginning of something more meaningful beneath the surface remains to be seen. What matters here is the growing disconnect between price and participation. The index remains near its highs, but the internal backdrop is becoming progressively less supportive. This does not yet look like wholesale trend deterioration. It does, however, look like a market where the internal margin for error is getting smaller. Price can continue higher under those conditions, but unless breadth begins to re-expand, we would treat further strength with increasing selectivity rather than increasing confidence. The indices are still near the highs. The internals are telling us not to get too comfortable. #TechnicalAnalysis #MarketBreadth #SP500 #MarketInternals #Equities #RiskManagement #IngeniumAnalytics

Divergence is one of the more useful concepts in market analysis, but it is also one of the most casually misused. A stock makes a new high, but an indicator does not. A sector breaks to a lower low, but a breadth measure refuses to confirm. Price advances, but participation fades underneath the surface. That can matter. But not every non-confirmation deserves to be called meaningful divergence. The first question should not be, “Is there a divergence?” The better question is, “Divergence against what, and over what timeframe?” A divergence against an untested, poorly understood, or loosely constructed indicator is often little more than chart decoration. It may look interesting, but looking interesting is not the same as carrying analytical weight. For divergence to matter, the reference point must matter. The indicator, model, breadth series, relative-strength measure, volume construct, or internal data set being used should have demonstrated value. It should reveal something price alone does not: participation, sponsorship, momentum persistence, demand/supply pressure, relative leadership, risk appetite, or internal deterioration. Timeframe also matters. A short-term divergence inside a longer-term uptrend may be nothing more than rotation, digestion, or a pause in sponsorship. A longer-term divergence against a major trend can carry a very different message. The analytical weight changes depending on whether the divergence is appearing on an intraday chart, a daily structure, a weekly trend, or across a broader market cycle. This is where discipline separates analysis from pattern hunting. A valid divergence is not simply an indicator failing to mimic price. It is a separation between surface behavior and internal condition, measured against a tool that has earned its seat at the table, across a timeframe that fits the decision being made. Even then, divergence is not a trade signal by itself. It is a condition. It is evidence. It is a warning flare, not a complete thesis. The mistake is treating every divergence as predictive. The more professional approach is to view it as a change in the quality of the move. Price may still be rising, but sponsorship may be thinning. Price may still be falling, but selling pressure may be losing force. The crowd sees the print; the analyst studies the condition behind the print. In markets, price is the final arbiter. But price does not always tell the whole story early enough. That is why valid divergence matters. Not because two lines disagree. But because a trusted measure, over a relevant timeframe, is telling us that the visible move and the underlying structure are no longer in full agreement. That is where the work begins. #TechnicalAnalysis #MarketBreadth #Marketstructure #Markets

$MRNA update to the July 2 post. MRNA has now extended sharply through the $62.55 level and is pressing toward the next marked resistance/target at $170.47, following positive Phase 3 INTerpath-001 melanoma data from Moderna and Merck. The important technical point: TRENDER never wavered during the pullback. The bullish profile stayed intact beneath the surface while price consolidated. With sizeable short interest in the name, forced covering appears to be part of the move. Not advice. Just structure. #MRNA #Moderna #Merck #Biotech #Melanoma #CancerVaccine #TechnicalAnalysis #TRENDER #ShortInterest #Trading

A prolonged bull market can teach investors a dangerous lesson: “The last time I worried, I was wrong.” Enough repetitions and caution begins to feel foolish. Dip-buying becomes reflexive. Confidence hardens into certainty. Risk gets discounted because recent experience keeps rewarding the same behavior. That is recency bias at work: turning a temporary market condition into a permanent expectation. #MarketPsychology #BehavioralFinance
A century later, the instruments have changed. The crowd hasn’t. The pursuit of easy money remains one of the most durable features of market psychology. #MarketPsychology #BehavioralFinance #Trading #JesseLivermore #technicalanalysis

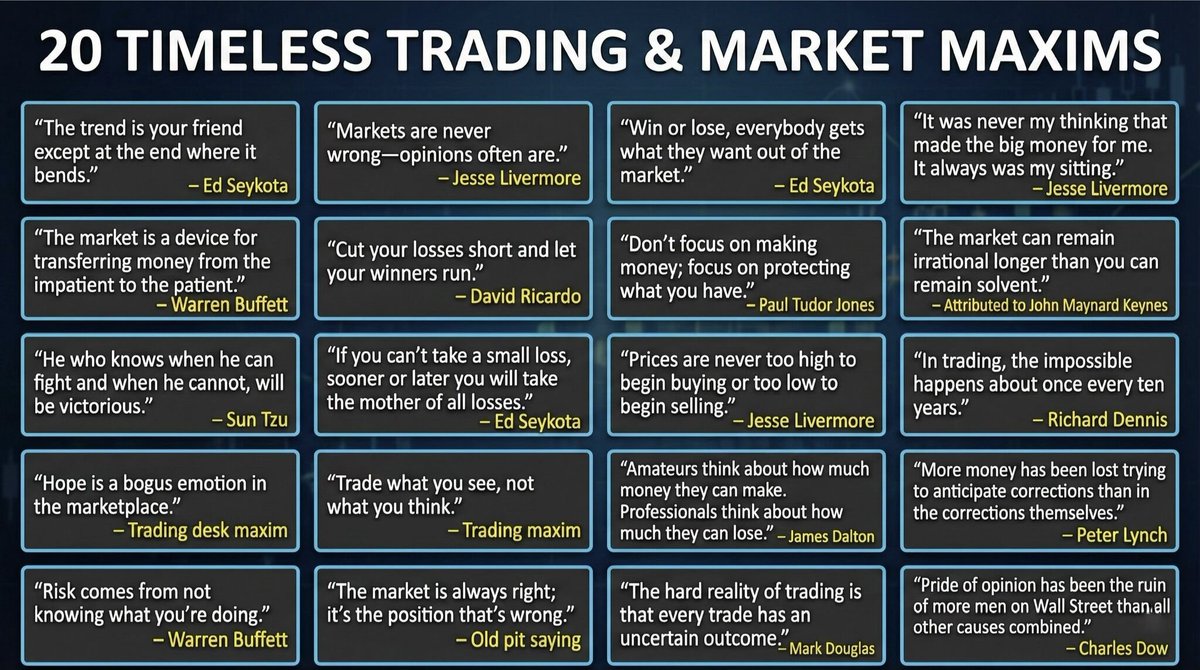
After enough market cycles spent on trading desks, where risk is real and time is unforgiving, one truth becomes unavoidable: technology evolves, instruments change, and market structure mutates—but human behavior does not. And because price is ultimately the expression of that behavior, the tape remains remarkably consistent across cycles. Real success in this business has never come from the most elaborate algorithm or the cleverest macro narrative. It comes from psychological discipline—the ability to respect trend, breadth, risk, and time when the crowd becomes emotional, overconfident, or loses its bearings. Indicators are only useful if the operator understands what they are actually measuring: behavior under pressure. Over decades and multiple market cycles, we have distilled the principles that consistently matter. They were not learned merely from textbooks or backtests, but through repetition across bull markets, bear markets, crashes, corrections, and long stretches of frustration. These are not slogans. They are operating maxims that align remarkably well with what disciplined technical analysis reveals once the noise is stripped away. Perhaps the most dangerous violation is pride of opinion. Behavioral finance has simply given academic language to what generations of traders already understood: ego is the enemy of P&L. Whether managing institutional flow or proprietary risk, disciplined respect for trend, internal participation, risk, and time—not prediction—is what separates professionals from tourists. The charts don’t care what we believe. They record what market participants are actually doing—and they do so with brutal honesty. #TechnicalAnalysis #BehavioralFinance #MarketStructure #RiskManagement #MarketBreadth #tradingPsychology #TrendFollowing #WallStreet #trading
Patience is not passivity. It is discipline. The market does not reward the analyst who predicts first. It rewards the one who waits for the evidence, respects confirmation, and acts when the weight of the data supports the call. “Patience, patience, and more patience—that is the key to success. Without market confirmation, do not make predictions or take action.” — Jesse Livermore Confirmation first. Conviction second. Action last. #TechnicalAnalysis #MarketStrategy #TrendFollowing #BehavioralFinance #RiskManagement
@EdricCassian Good eye on the timing, though this is not standard RSI. TRENDER is a proprietary trend/momentum measure I use to identify when pressure is shifting beneath the surface. The improvement there helped confirm the developing price structure before the breakout through $62.55.
$MRNA update to the Jun 17 post. MRNA has traded through the $62.55 resistance level and has continued higher, aided by elevated short interest, a constructive Science Day/pipeline update, and a positive chart structure. The stock is now pressing into relative new territory, with the next target/resistance levels marked on the chart. Not advice. Just structure. #MRNA #Moderna #Biotech #TechnicalAnalysis #ShortInterest #Trading #MarketStructure

Track records are curated memories. The calls that aged badly get quietly buried. That often tells you more about the analyst than the calls that aged well. #Markets #TechnicalAnalysis #BehavioralFinance #RiskManagement
All Mag7 stocks now find themselves in negative daily trends as measured by the TRENDER. $NVDA, $AAPL, and $GOOGL remain positive on the weekly TRENDER, so this is not yet a complete breakdown in longer-term leadership. But with the $SPX now breaking its own daily TRENDER, the setup has become more fragile. Our Breadth Engine has improved, which suggests rotation beneath the surface. The issue is whether that improvement can mature into real leadership quickly enough to offset weakness in both the index and the former generals. At this stage, I would call it a warning, not a verdict. The market needs breadth to become leadership. Otherwise, rotation may not be enough. #Markets #TechnicalAnalysis #SPX #Mag7 #MarketBreadth #SectorRotation #TrendFollowing #Equities #Trading #MarketLeadership

hey luna 💫 @thicketluuna
0 Followers 150 Following kind with a playful side 🤍 • dms on, test them — i reply
Sayed @Sayed87722527
0 Followers 368 Following
Lea @Lea4105081
2 Followers 459 Following
ARTIOM @ArtiomLebedev
91 Followers 732 Following There’s a part of me that is unfamiliar to myself. And I keep finding myself there
Jeffery Miller @jmillgocougs89
459 Followers 3K Following Equal Rights | Equal Justice | Equal Love | Equal Pronouns | Equal Opportunity | Equal Pay 🟦🟧🏳️🌈🇺🇦 He/Him | Democracy dies gradually and then suddenly.
Robert W @R0b3r7w
25 Followers 264 Following Following macro trends, AI infrastructure, semis, and future technology.


AJ @ajl_ts
158 Followers 292 Following Helping developers turn indicators into businesses @TrendSpider
SigmaTrader🇺🇸 @Agivu694410
54 Followers 2K Following 15-30% Monthly | 2 High-Conviction Stocks.Short-Term Gains: 15-20% in Days/Weeks.DM "JOIN" for WhatsApp Alerts. Live Trade Signals • Market Analysis
副業としての株... @Gaju413719
37 Followers 2K Following 【完全無料】 25年の株式投資プロチーム(運用資産500億円以上)が提供:毎日の市場分析レポート + 優良成長株のピックアップ。プロの情報を無料で。まずはお気軽にお問い合わせください。
Grace @Iteagi844
1 Followers 119 Following 🚀 brave girl here, boldly hooked on hunting value stocks! open to insights. DM me for commodity ETFs! ✨ #ValueInvesting
Fawn @Dorotal10210
14 Followers 342 Following ⚡ cool stock investing is my game, brave girl! seeking strategy talks. DM me for blue-chip stocks! ✨ #Markets #Investing
Hodor @chartsmarterof
76 Followers 1K Following XAH & XRP Community Financial Sovereignty is A ХАН | XRP|EVR You can be my friend and disagree with me

Optuma @Optuma
10K Followers 459 Following Empowering Traders, Analysts, and Portfolio Managers to discover unique market opportunities with powerful software and valuable education.
Patrick Dunuwila, CMT @Pdunuwila
5K Followers 3K Following

The Chart Report @TheChartReport
41K Followers 1K Following The newsletter with no news, just charts.
B Anthony Weber @TwVille123
522 Followers 750 Following Growth Stock Investor, Husband, Father and Conservative. Any investment opinions are my own and should not be misconstrued as advice. Trade at your own risk.
QuantumGlass @ElliottWaveSta1
4K Followers 3K Following 📈 XAG-XAU-BTC-ETH Forecasting-🤖 Machine Learning AI Model 📊Quantum Finance. No trading recommendations.Educational only.
CSR Pathway @CSRpathway
219 Followers 988 Following CSR Pathway provides Consulting Services to help our clients build a Sustainable Business Model and technology tools that assist their model implementation.
Chuck Mikolajczak @ChuckMik
1K Followers 2K Following @Reuters U.S. markets correspondent-views are mine alone. Brooklyn born and bred - Yankees, Isles and Jets, go figure. Longstanding Knicks boycott.
Thomas Thornton @TommyThornton
136K Followers 8K Following Hedge Fund Telemetry - Data Collection, Analysis, Communication, and Control. Long/Short hedge fund manager
Russell Sean @RussellQuantum
9K Followers 5K Following @QuanMed_AI- medical robotics research system by AI and Quantum not big Pharma on @Quan_Chain the only auto-migrating quantum chain. MSc Neuro/AI-Robotics Dev
Dylan Patel @dylan522p
167K Followers 1K Following SemiAnalysis AI Infrastructure Research and Consulting DMs are open for consulting, quotes, or to talk shop, Opinions my own
David Zarling, CMT @AdaptivCharts
5K Followers 326 Following Partner, Head of Investment Strategy & Research at @CLiENTF1RST Tax & Wealth Advisors, creator of @Adaptiv and @ADPV_etf. Tweets are not investment advice.
Linda Raschke @LindaRaschke
145K Followers 132 Following Private Trader, Retired top performing hedge fund manager, in New Market Wizards, 2024 IFTA Lifetime Achievement Award. Street Smarts & Trading Sardines author.
Larry Kudlow @larry_kudlow
266K Followers 333 Following @foxbusiness host, Former Assistant to the President & Director of the NEC @whitehouse @realDonaldTrump

Cassandra Unchained @michaeljburry
2.1M Followers 40 Following Official X account for Michael Burry, MD, called "Cassandra" by Warren Buffett. Now on Substack My Web Site: https://t.co/hQcaqheax5
World Economic Forum @wef
4.3M Followers 975 Following The international organization for public private cooperation. #wef26
Baird Strategas @BairdStrategas
15K Followers 8 Following Baird Strategas is a leading institutional brokerage firm providing macro research, advisory and capital markets services.
Christophe Barraud �... @C_Barraud
213K Followers 401 Following Head of Discretionary Management and Research at LIOR GP | PhD | Bloomberg 🇺🇸 🇪🇺 🇨🇳 "Top Forecaster" for several years | RT ≠ endorsement
Maria Bartiromo @MariaBartiromo
1.6M Followers 2K Following Two-time Emmy award winning journalist with a front row seat to the global economy, dc & Wall Street for 3+decades, covering news @cnn, @cnbc & @FoxNews
unusual_whales @unusual_whales
5.4M Followers 2K Following API Free trial: https://t.co/FMKNJWJquj Discord: https://t.co/0xJ9e0ZYYG Market news, trading tools Real-time option flow, screeners, GEX Custom alerts & more NFA
Sebastian Messina CMT... @SebastianMessi3
733 Followers 4K Following
Cathie Wood @CathieDWood
3.0M Followers 524 Following Founder, CEO and CIO @ARKinvest. Thematic portfolio manager for disruptive innovation, mom, economist, and women's advocate. Disclosure: https://t.co/chxRD4oWOd
Robert W @R0b3r7w
25 Followers 264 Following Following macro trends, AI infrastructure, semis, and future technology.
Traders Union @TradersUnion_TU
87K Followers 25 Following Traders Union is a financial trading portal that helps traders succeed. We provide all the necessary information to support your trading journey.
Earnings Hub @EarningsHubHQ
71K Followers 104 Following Free Earnings Calendar, Analyst Expectations, Actual Results, Earnings Calls and much more. The Ultimate Earnings Calendar: https://t.co/MEubmLeOrl
Businessweek @BW
2.3M Followers 575 Following A compass for the changing world of money, power and technology. Bw Daily: https://t.co/2ntK5Q4bo8
Robert Prechter @RobertPrechter
17K Followers 77 Following Author of 18 books incl. bestsellers Conquer the Crash & Elliott Wave Principle. Personal tweets signed -RP. Managed by @elliottwaveintl. RT ≠ endorsement.
Raoul Pal @RaoulGMI
1.5M Followers 2K Following Founder/CEO Global Macro Investor, @RealVision. Figuring things out at the nexus of Macro, Web3 & the Exponential Age. Not a guru.
David Rosenberg @EconguyRosie
310K Followers 338 Following Founder and President of Rosenberg Research & Associates Inc. Retweets, Likes and Follows are not endorsements.
New York Post @nypost
4.2M Followers 10K Following Breaking news, features and more from the NY Post. Follow ➡️ @pagesix, @nypmetro, @nypostbiz, @nypostsports, @nypfashion, @nypostopinion, @vrtpod, @_nynext
*Walter Bloomberg @DeItaone
2.0M Followers 40 Following
Kantro @MichaelKantro
114K Followers 994 Following Chief Investment Strategist @Piper_Sandler. Voted Wall Street's #1 Portfolio Strategist 24, 25, 26. CFA. Girl Dad. $LITL PM. https://t.co/EBG0jU7WoE

Nav Toor @heynavtoor
152K Followers 256 Following Helping you master AI daily with step-by-step AI guides, latest news, & practical tools • DM for Collabs
Lowry Research @LowryResearch
1K Followers 24 Following We are the oldest technical investment advisory in the United States. Since 1938, we applied the basic forces of Supply and Demand to time world stock markets.
Barry Ritholtz @Ritholtz
256K Followers 3K Following Chair/CIO of RWM https://t.co/St006fc1z6 Masters-in-Business podcast/radio host Director of Cognitive Dissonance
Tier1 Alpha @t1alpha
51K Followers 856 Following Leveraging Market Structure through Options, Volatility, Passive flows, and Systematic Rebalancing. Research Distributed through @Hedgeye
Nautilus Research @NautilusCap
51K Followers 750 Following A Research boutique providing institutional investors with insight for today's markets. Not investment advice. https://t.co/GMYzzgharS
副業としての株... @Gaju413719
37 Followers 2K Following 【完全無料】 25年の株式投資プロチーム(運用資産500億円以上)が提供:毎日の市場分析レポート + 優良成長株のピックアップ。プロの情報を無料で。まずはお気軽にお問い合わせください。
SigmaTrader🇺🇸 @Agivu694410
54 Followers 2K Following 15-30% Monthly | 2 High-Conviction Stocks.Short-Term Gains: 15-20% in Days/Weeks.DM "JOIN" for WhatsApp Alerts. Live Trade Signals • Market Analysis
J.P. Morgan @jpmorgan
859K Followers 47 Following Official account for the latest company news and updates from Asset Management, Private Banking, and the Commercial and Investment Bank.
Daily Chartbook @dailychartbook
46K Followers 473 Following The day's best charts & insights, curated: https://t.co/N9qmOV94DF Backtests: https://t.co/wxCAzTDjPz
Fox News @FoxNews
29.4M Followers 182 Following Stay Ahead. Get Breaking News Here First. Download the App.
Cathy Lafee @CathyLafee
69 Followers 357 Following
Morningstar, Inc. @MorningstarInc
240K Followers 681 Following We are a leading provider of independent investment research. Our mission is to empower investor success.
Grayson Roze @GraysonRoze
9K Followers 580 Following Chief Strategist @StockCharts | Author of “Trading For Dummies” and “Tensile Trading” | @Porsche Geek 🏎️ | Watch Nerd ⌚️ | Drummer 🥁
Bloomberg @business
10.5M Followers 104 Following The first word in business news | Watch Live: https://t.co/nHEpHOzHqv | Newsletters: https://t.co/nWaCxHSKuU | Podcasts: https://t.co/096e9xMbPz
Lyn Alden @LynAldenContact
1.1M Followers 1K Following Author of Broken Money & The Stolguard Incident. Investor with a blended engineering/finance background. GP @egodeathcapital. Director at Bakkt & @Swan.
Andrew Ross Sorkin @andrewrsorkin
1.2M Followers 4K Following @NYTimes Columnist/Editor & @SquawkCNBC Co-Anchor. Author, “1929” + “Too Big To Fail”. Founder, @DealBook. CoCreator, BILLIONS @Showtime. Proud Dad.
Capital Flows @Globalflows
227K Followers 2K Following Disciple of Jesus Christ | Global macro trader | Managing risk in rates, fx, and equities | Capital Flows Research is linked below:
Dan Ives @DivesTech
342K Followers 366 Following Partner and Senior Managing Director Yorkville Ives: Tech analyst on Wall Street 25+ years. Chairman of IVAI. Advisory Board of Zeta 🎯🔥🏆🐂🕶️🌎✈️
EllioTrades @elliotrades
929K Followers 2K Following Narrative Dealer and Builder Next move loading... [email protected]
Dr.Hash“Wesley” @CryptoApprenti1
223K Followers 1K Following Poker player, Trader, Chinese whale, @drhashclub, #Binance 币安一键注册:https://t.co/Pn6cv1bBMo, #OKX 一键注册:https://t.co/jglJHzfUcb

You might like