PlanTwentyOne @PlanTwentyOne
PLAN21 | Aggressively loading BTC & ETH in strong zones | Straight talk, no bullshit | Accumulation hunter | Not financial advice #Crypto #Bitcoin $BTC $ETH t.me/PlanTwentyOne Joined May 2026-
Tweets77
-
Followers20
-
Following9
-
Likes92
🇨🇳 China is already showing how the AI BUBBLE can burst. 🇺🇸 Is the US next? Look at two Chinese indices. 🇨🇳 000300 (China’s $SPY equivalent): −21.8% from the local high. 🇨🇳 000688 (China’s $QQQ equivalent): −44.6%. The second index, focused on China’s tech and innovation sector, has already lost almost half its value — after a powerful rally that not long ago looked like the start of a new growth cycle. Now the main question: What if the Chinese market is showing us the future of the American stock market? Look at the S&P 500 and Nasdaq 100. For years, US tech giants have driven expectations around artificial intelligence — and with them, valuations and capital concentration in a handful of the largest names. But every bubble has one trait: while it’s inflating, it feels like this time is different. Until the market starts proving otherwise. The Chinese charts are not proof that the US must follow the same path. But they show how painful the reversal can be when expectations collide with reality. And the most uncomfortable part: if a similar process begins in the US, it may not stay limited to the tech sector — it could affect the entire stock market. Maybe we’re not looking at the distant future. Maybe the first signals are already in front of us. The only question is whether the market will reprice the risk before prices do. #Crypto #Bitcoin bitcoin:native $ETH


The inevitable can be delayed, but it cannot be avoided. #Crypto #Bitcoin $BTC $ETH

How deep can the stock market fall? The main question is whether the decline in SPX 500, NASDAQ, DJI and NVDA will stay a normal correction — or turn into a more serious move lower that drags BTC with it. SPX500 Trading around $7,640 after another failed attempt to continue
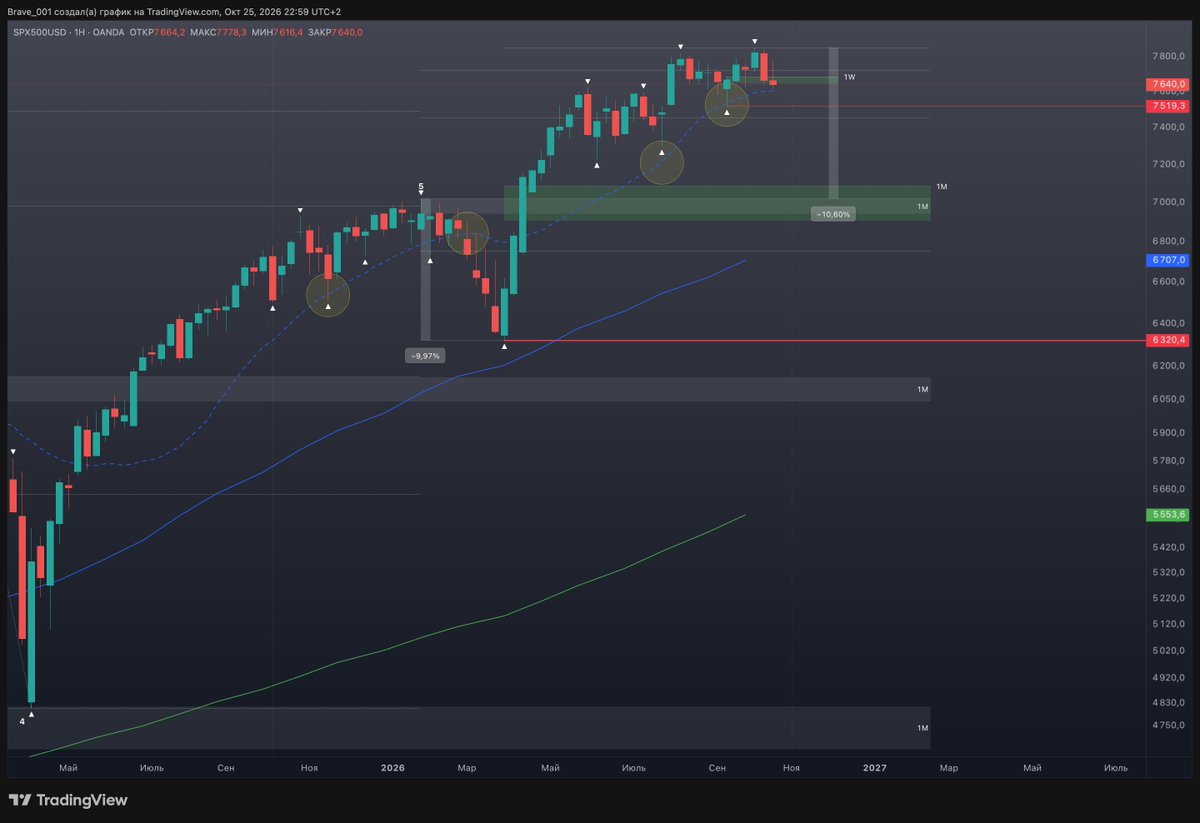


How deep can the stock market fall? The main question is whether the decline in SPX 500, NASDAQ, DJI and NVDA will stay a normal correction — or turn into a more serious move lower that drags BTC with it. SPX500 Trading around $7,640 after another failed attempt to continue higher. Nearest support is $7,519. A break below it raises the probability of a move into the $6,900–$7,100 area. The next meaningful support sits around $6,320. DJI Nearest support zone is $49,000–$50,000. If sellers keep pressing and this area fails to hold, the next significant target could be around $45,050. NASDAQ Nearest level is $28,750. A sustained break below it opens the door to the $25,800–$26,800 zone. NVDA Showing weakness after attempts to push the highs in the $235–$240 area. Price is currently around $211, sitting at the lower boundary of an ending diagonal that is likely to break, opening a path toward $165. NVIDIA carries roughly 8% weight in both the SPX500 and NASDAQ — an enormous share for a single company. Its further decline can put meaningful pressure on both indices, especially given the heavy attention the market pays to it. If NVDA keeps falling, it becomes harder to expect resilience from the broader market — particularly if other major tech names start to join the move. #Crypto #Bitcoin $BTC $ETH
Post from 28.09.2026 SPX 500 closed Friday at $7,753.8. Less than 1% away from the August 13 record of $7,821.6. At first glance, the market is almost at the highs. But if you look under the hood, a question appears: how many stocks are actually participating in this rally?
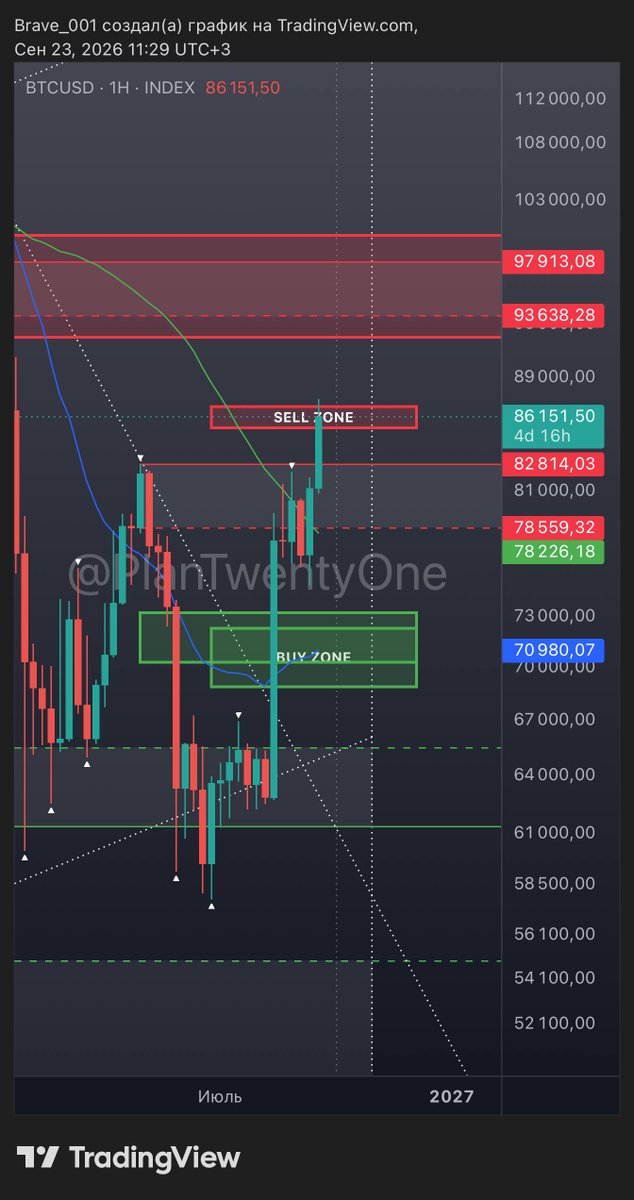
About the BULL TRAP. My original bear market scenario looked like this: I viewed the drop in BTC from $126,000 to $60,000 as the first wave of the decline, after which I expected a correction into the $79,000–$84,000 range, followed by a second wave down from around $82,000 — similar in scale to the first — that would take BTC into the $34,000–$44,000 zone. But after price held below the October low, instead of the expected continuation toward $40,000, we got a reversal higher and a return above $82,850 — the level that, from a market structure standpoint, marks the line for a global trend change on BTC. As I’ve written before, what still bothers me is that the metrics haven’t reset. That’s why I continue to view this rally primarily as a correction of the prior decline, with the risk of a bull trap. On the chart I’ve marked the potential bull trap that could define the next major move in BTC. The key zone — the real line in the sand between bulls and bears — is $69,000–$73,000. This is where BTC will show its next directional bias. If buyers defend this block and price gets an impulsive bounce off it, the probability of further upside increases significantly, and the first meaningful target would be the $100,000 area. If price impulsively breaks this block and holds below it, the scenario shown on the chart activates: the entire move from February to October becomes a complex correction between two down waves, and the odds of a break below $60,000 rise sharply. Of course, such a decline should ideally be accompanied by an active sell-off in the stock market. In my view, a correction in equities has already started — but it’s not yet the aggressive decline that would be needed. #Crypto #Bitcoin $BTC $ETH
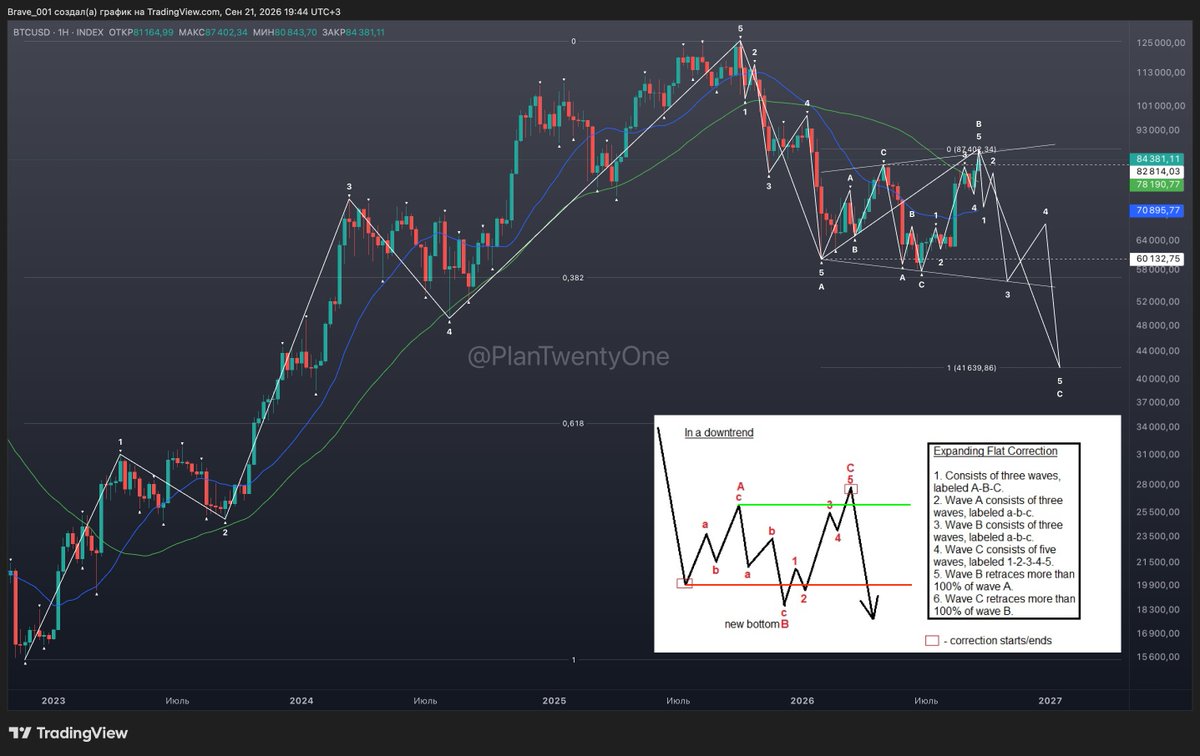
BTC is squeezed between two local blocks. For the downside scenario toward $69,000–$73,000 to play out, BTC needs an impulsive move below $79,500 and a hold under that level. My interest zone for ETH is $2,000–$2,200. #Crypto #Bitcoin $BTC $ETH

Post from 23.09.2026 On the night of September 21–22, a Russian missile hit my house. I survived only because I reacted in time. If I had been a few minutes late, I wouldn’t be writing this — and the channel would have become a ghost. Because of these events, I’m pausing the

Behind BTC’s rally is a very specific type of demand — ETF flows and already-covered shorts from $60,000. This is not a new wave of cheap money. Since July, net liquidity that drives inflows into high-risk assets has been declining, while price has been rising. When the stock market breaks, that same channel will amplify the downside: funds will see outflows, and the only thing left under the price will be a liquidity squeeze. #Crypto #Bitcoin $BTC $ETH
Interesting picture taking shape. #Crypto #Bitcoin $BTC $ETH

Forget the Four-Year Cycle for a Moment Sometimes it’s genuinely hard to stick to your view when there’s so much noise around. Today I’m deliberately stepping away from the four-year cycle debate and looking at a liquidity metric instead. This metric was originally created to

Post from 28.09.2026 SPX 500 closed Friday at $7,753.8. Less than 1% away from the August 13 record of $7,821.6. At first glance, the market is almost at the highs. But if you look under the hood, a question appears: how many stocks are actually participating in this rally? Only a quarter of SPX 500 stocks are trading above their 50-day MA. On the day of the all-time high, that number was much higher. So the index has almost returned to its peak, while internal market breadth has deteriorated significantly. Only half of the stocks are above the 200-day MA, and a large share — about 59% — is already in a deep drawdown of 20%+ from their highs. Meanwhile, the SPX 500 still looks very strong. Why? Concentration. A handful of the largest companies carry enormous weight in the index. NVIDIA, Apple, Microsoft and a few other giants can keep pulling the SPX 500 higher even while most of the remaining stocks are already weakening. That’s why today there is an important illusion: the SPX 500 looks stronger than the market as a whole. At the same time we also see: — High cost of money — Rising long-term bond yields — Expensive oil — Inflationary pressure — Massive capex from AI companies — A market that is increasingly dependent on a few mega-cap names In September, the US10Y yield rose to 5.225%, and the US30Y reached levels not seen in more than a decade. Meanwhile the SPX 500 is sitting almost at all-time highs. These kinds of divergences are the ones I consider dangerous. The chain of events looks roughly like this: cheap money → asset inflation → high concentration → inflationary pressure → rising oil → rising long-term yields → deteriorating market breadth → pressure on expensive stocks → market break → sell-off. Right now I’m not looking at the market and asking “Why is it still going up?” I’m asking: “What happens when the small group of companies currently holding up the entire index starts to fall?” #Crypto #Bitcoin $BTC $ETH

Behind BTC’s rally is a very specific type of demand — ETF flows and already-covered shorts from $60,000. This is not a new wave of cheap money. Since July, net liquidity that drives inflows into high-risk assets has been declining, while price has been rising. When the stock market breaks, that same channel will amplify the downside: funds will see outflows, and the only thing left under the price will be a liquidity squeeze. #Crypto #Bitcoin $BTC $ETH
Interesting picture taking shape. #Crypto #Bitcoin $BTC $ETH
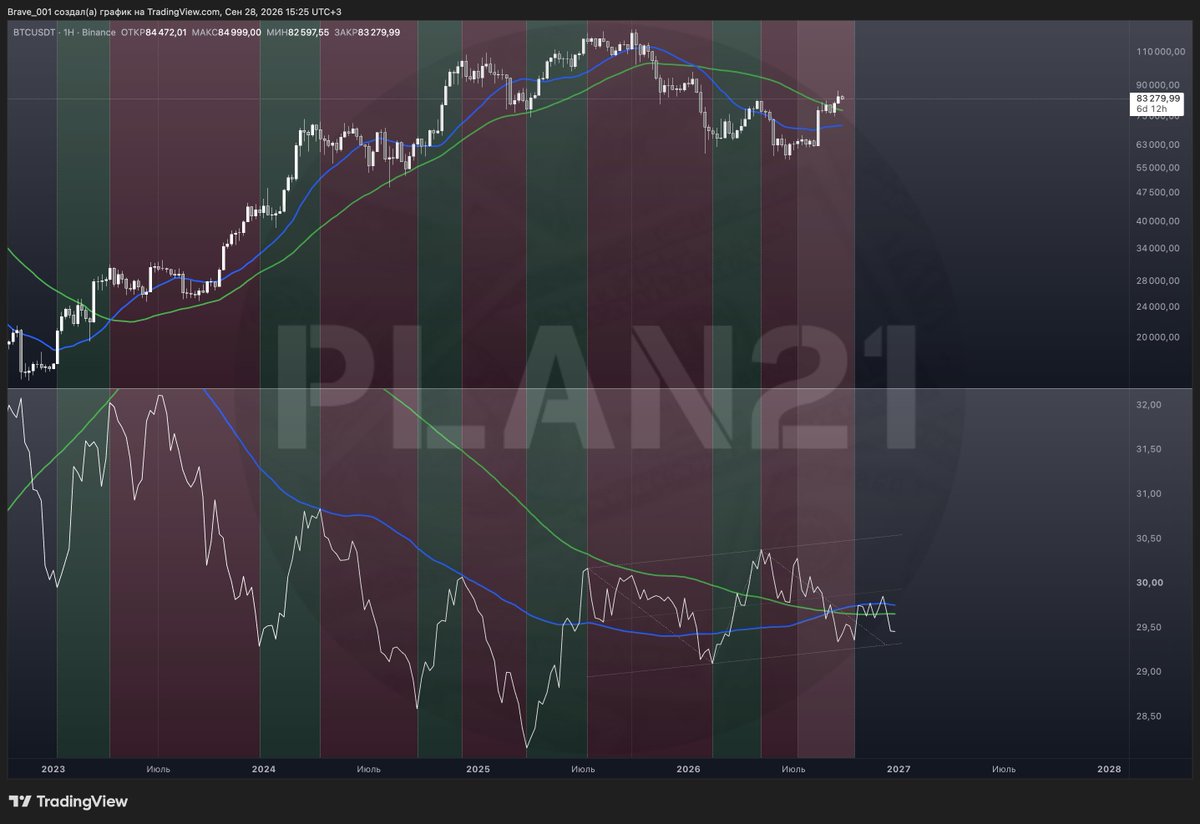
Forget the Four-Year Cycle for a Moment Sometimes it’s genuinely hard to stick to your view when there’s so much noise around. Today I’m deliberately stepping away from the four-year cycle debate and looking at a liquidity metric instead. This metric was originally created to
BTC closed the weekly candle above $82,850. From a technical standpoint, the bear market has flipped into a bull market. #Crypto #Bitcoin $BTC $ETH
Post from 23.09.2026 On the night of September 21–22, a Russian missile hit my house. I survived only because I reacted in time. If I had been a few minutes late, I wouldn’t be writing this — and the channel would have become a ghost. Because of these events, I’m pausing the
SPX 500 closed Friday at $7,753.8. Less than 1% away from the August 13 record of $7,821.6. At first glance, the market is almost at the highs. But if you look under the hood, a question appears: how many stocks are actually participating in this rally? Only a quarter of SPX 500 stocks are trading above their 50-day MA. On the day of the all-time high, that number was much higher. So the index has almost returned to its peak, while internal market breadth has deteriorated significantly. Only half of the stocks are above the 200-day MA, and a large share — about 59% — is already in a deep drawdown of 20%+ from their highs. Meanwhile, the SPX 500 still looks very strong. Why? Concentration. A handful of the largest companies carry enormous weight in the index. NVIDIA, Apple, Microsoft and a few other giants can keep pulling the SPX 500 higher even while most of the remaining stocks are already weakening. That’s why today there is an important illusion: the SPX 500 looks stronger than the market as a whole. At the same time we also see: — High cost of money — Rising long-term bond yields — Expensive oil — Inflationary pressure — Massive capex from AI companies — A market that is increasingly dependent on a few mega-cap names In September, the US10Y yield rose to 5.225%, and the US30Y reached levels not seen in more than a decade. Meanwhile the SPX 500 is sitting almost at all-time highs. These kinds of divergences are the ones I consider dangerous. The chain of events looks roughly like this: cheap money → asset inflation → high concentration → inflationary pressure → rising oil → rising long-term yields → deteriorating market breadth → pressure on expensive stocks → market break → sell-off. Right now I’m not looking at the market and asking “Why is it still going up?” I’m asking: “What happens when the small group of companies currently holding up the entire index starts to fall?” #Crypto #Bitcoin $BTC $ETH


Som Rega @tom_sarega
716 Followers 4K Following
Joao Wedson @joao_wedson2
53 Followers 1K Following 💎Founder & CEO of @Alphrctal 🥇Verified Author at @CryptoQunt_com & @CoinMaketCap ⚙️MSc in Data Science & AI 🦾Engineer in Robotics & Automation Bitcoin OG
Polygold @polygoldtrade_
108 Followers 50 Following World First Social Prediction Copy Bot Stop predicting. Start following | Powered by @PolymarketBuild | https://t.co/hGKWkE8x9G GPoly! ⚡️
좋은생각 @o2k1mg
29 Followers 44 Following
dary @dary_a41380
29 Followers 183 Following
sol4 @solprime4
2 Followers 63 Following
Chaileey⭐️ @chaileylovesyou
429 Followers 1K Following Discover the little moments of happiness each day.

Max Alvarez @Alvar75365
184 Followers 455 Following
Jessica Li @suadela_li
90 Followers 709 Following
Łukasz Muchla @Muchla_L
26 Followers 168 Following
Pekka Kuittinen @pekkakuittine
758 Followers 3K Following Active growth swing trader, Investor PhD You can follow and copy my traiding on eToro: https://t.co/slXYWLDOQg
GUSTAVO RUIZ @DES_INMOB
3 Followers 162 Following DESARROLLADOR INMOBILIARIO. Transformando el Ciclo de Vida Inmobiliario. Experto en Metodología BIM, Fraccionamiento Inmobiliario y Tokenización de Activos.
CryptoBullet @herlinahauw86
183 Followers 2K Following Trader • Market Analyst Bybit : https://t.co/PDdxovnlIA cryptobullet $30K Welcome Bonus BloFin : https://t.co/S43WiCvkDm $5K Bonus
Benjamin Cowen ||@cha... @X_BenjaminCowen
42 Followers 2K Following Founder & CEO, ITC | Macro, commodities & digital assets | Liquidity, labor & risk cycles | PhD | Former NASA, Sandia National Labs
Justin Banks (Private... @JustinBanksu
80 Followers 4K Following Trading growth stocks, cycles & emerging themes. Focused on what's next - not what already moved. Wolves of Wealth🐺

RunTheTable @werunthetables
130 Followers 2K Following
. @DrProfitCryptp0
122 Followers 270 Following
The Kobeissi Letter @KobeissiLetter
2.7M Followers 604 Following Official X account for The Kobeissi Letter, an industry leading commentary on the global capital markets. Email us: [email protected]
Joao Wedson @joao_wedson
20K Followers 676 Following 💎Founder & CEO of @Alphractal 🏅Verified Author at @CryptoQuant_com & @CoinMarketCap ⚙MSc in Data Science & AI 🦾Engineer in Robotics & Automation ₿itcoin OG
CryptoBullet @CryptoBullet1
183K Followers 114 Following Trader • Market Analyst Bybit : https://t.co/Ba5wJCA1jH 🚀 $30K Welcome Bonus BloFin : https://t.co/E4pkIS4axj 🔥 $5K Bonus
Benjamin Cowen @benjamincowen
1.3M Followers 1K Following Founder & CEO, ITC | Macro, commodities & digital assets | Liquidity, labor & risk cycles | PhD Engineering | Former NASA, Sandia National Labs
Alessio Rastani @alessiorastani
70K Followers 3K Following Chart analyst on stock markets, metals and crypto with elliott wave theory at https://t.co/aowxoU58bJ. Dedicated to helping others understand the charts.
CryptoQuant.com @cryptoquant_com
291K Followers 33 Following Leading On-chain Data/Analytics Provider 💡 Insights: https://t.co/4soN6kP21x 🔔 Alerts: https://t.co/kINun4rMMM
Doctor Profit 🇨�... @DrProfitCrypto
524K Followers 825 Following Elite trader, I trade psychology, $BTC and Stocks| Educational content only. NO FINANCIAL ADVICE Join Premium: https://t.co/TvHxOtKhHj
glassnode @glassnode
609K Followers 61 Following Digital asset data, analytics, and research. https://t.co/VrKU3mBzsv https://t.co/oQcrlZNkPF
Alphractal @Alphractal
15K Followers 221 Following Crypto market intelligence. On-chain, macro, derivatives, sentiment. Insights: https://t.co/h2cWqiqfew Reports: https://t.co/qUjW8GFOTmTrends for United States
You might like