Neo Wang @VisualizerNeo
Data Visualizer Shanghai, China Joined June 2017-
Tweets14
-
Followers8
-
Following68
-
Likes9
Introduction to AntV: observablehq.com/@jiazhewang/in…
I just published AntV ChartCube: One-Stop Online Chart Maker link.medium.com/Kxf9fZ6PO1

This really is one of the best data visualization books I have. I’ll certainly be writing about Marie Neurath’s life and work soon!!

Globe.gl is here! 🌍 A JS framework for Globe data visualization. Check it out! 😎 github.com/vasturiano/glo…

Want to map great circle routes in your viz? 🗺 Now you can! Our team breaks down how in the newest release of Tableau: tabsoft.co/2MI4PLt

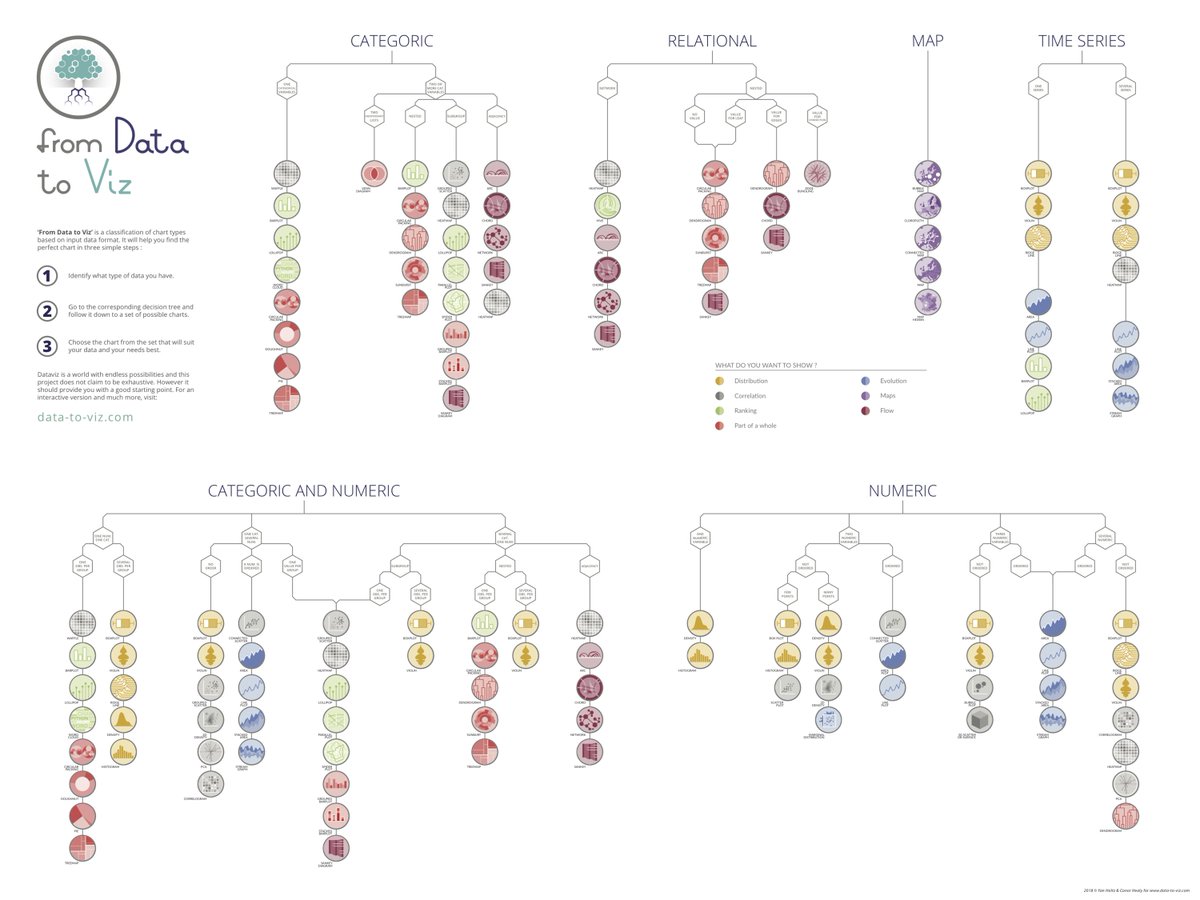
🍾 I'm glad to announce a new #dataviz project: --> data-to-viz.com A classification of chart types based on data input format. Includes a lot of #rstat code, a poster for @useR2018_conf , a gallery of caveats, and plenty of tips and tricks!
Zen Master @YvanFornes breaks down how and why you should add illustrations to your dashboard: tabsoft.co/2Ax1Ofd


More cartogram transitions: bl.ocks.org/veltman/33dbad…

Brett Cooper @hellonearthis
862 Followers 2K Following Woke He/Him We might make mistakes but we will make other things too - Michael Joseph Savage

Sadie Short @SadieShort17
2K Followers 3K Following Just waiting for @juliancamarena to notice me and fall in love with me.......I LOVE YOU your voice makes me cry....IN A GOOD WAY!!
Sever @Starmoon0708
2 Followers 32 Following
Amit Biswas @amitbiswas7214
924 Followers 3K Following
depicture @depictureio
777 Followers 2K Following Web development / design and marketing studio. We aсhieve goals, drive sales and brand recognition.
Mary Taylor-Series Ex... @butfirstmath
356 Followers 921 Following “If you can do no good, at least do no harm” • Research actuary • Math nerd •
Visualr Software @visualrsoftware
633 Followers 678 Following Data Visualization and Data Analytics Software. Convert raw data into insights. #datavisualization #dataanalytics #BI #MachineLearning #SaaS #datamining
Jason Spielman @jayspiel_
7K Followers 240 Following Co-Founder @gethuxe • Prev. @notebooklm (GoogleLabs) • 📸 IG: Jayspiel
IEEE VIS @ieeevis
9K Followers 75 Following The premier forum for visualization advances for academia, government, and industry. We invite you to share your research, insights, and enthusiasm at IEEE VIS
Alibaba Group @AlibabaGroup
261K Followers 2K Following Driven by passion and imagination, we are at the forefront in AI, Cloud, and e-commerce. Join us on this journey! 🚀✨
Rajat Gupta @0xRajat
3K Followers 456 Following Founder/CEO @ https://t.co/HoVbaHbHHc → World's #1 All-in-One AI Platform 🌎 Prev @Adobe

Interactive Data Lab @uwdata
8K Followers 282 Following Visualization & data analysis at @uw @uwcse. In a previous life was the Stanford Vis Group.
Trifacta is now part ... @Trifacta
11K Followers 1K Following Follow us on @alteryx for continued Designer Cloud #DataEngineering innovations. Experience the power of #AnalyticsForAll with #AnalyticsAutomation!
Dominik Moritz @domoritz
4K Followers 1K Following Prof @cmuhcii @cmudig, researcher @apple. Interactive vis tools (e.g. @vega_vis). PhD @uwcse @uwdata. Also at https://t.co/LRqaJKlFKx and https://t.co/xuDiV7I9Jx
Jeffrey Heer @jeffrey_heer
12K Followers 793 Following UW Computer Science Professor. Data, visualization & interaction. he/him. @uwdata @uwdub @vega_vis ex-@trifacta

Ant Financial AntV @AntV_Alipay
64 Followers 18 Following

Donald J. Trump @realDonaldTrump
109.5M Followers 53 Following 45th & 47th President of the United States of America🇺🇸
Nadieh Bremer @NadiehBremer
47K Followers 549 Following Award-winning Data Visualization Designer | Founder of Visual Cinnamon | Graduated Astronomer ✨ | Author of "CHART" & "Data Sketches" | 🇳🇱


Data Visualization So... @DataVizSociety
79K Followers 313 Following We are dedicated to fostering community for data visualization professionals. Follow us on Bluesky: https://t.co/mQkiZ5ZPhd
Game of Thrones @GameOfThrones
7.9M Followers 33K Following Only one can rule. Stream all seasons of #GOT on @HBOMax
Sever @Starmoon0708
2 Followers 32 Following
ruanyf @ruanyf
191K Followers 374 Following Stay Focused, Keep Shipping. Build Early, Build Always. Improve yourself, Write solid/simple/stupid code.
sima @SimaZwx
34 Followers 86 Following
Yan Holtz @R_Graph_Gallery
22K Followers 674 Following Software engineer who ❤️ #dataviz. Creator of https://t.co/sj29jZPkYr and the R, Python, D3 and React graph galleries. ➡️ https://t.co/PoJNeHXz8a 📈 🌊 🍺
Tako Nats @TNatsvlishvili
735 Followers 3 Following Model at @nextmodels Paris//Milan//NYC//London Mother agency Lookmodéls. GERMANY-@Modelwerk SPAIN-@Unomodels
Freakonomics @Freakonomics
591K Followers 958 Following Follow the Freakonomics Radio podcast for weekly episodes that explore the hidden side of everything — with host Stephen J. Dubner.

Processing.js @processingjs
7K Followers 23 Following Processing is an open programming language for people who want to program images, animation, and interactions for the web without using Flash or Java applets
Processing @ProcessingOrg
36K Followers 395 Following We cultivate creative code and communities to empower learners, coders, and artists to shape equitable digital futures.
p5xjs @p5xjs
30K Followers 401 Following An open-source JavaScript library for learning to code and create art, prioritizing accessibility, inclusivity, and community. 🌸 https://t.co/Zt66XjgYwb
Celine Farach @CelineFarach
51K Followers 1K Following
depicture @depictureio
777 Followers 2K Following Web development / design and marketing studio. We aсhieve goals, drive sales and brand recognition.
Vasco Asturiano @vastur
956 Followers 367 Following Moved to 🦋 https://t.co/rTw0Mk4jsu. Empowering humans, one pixel at a time. #ux #dataviz #d3js Doing network stuff @cloudflare.
David Pires @davidmpires
4K Followers 2K Following Product Analytics and Visualisation at @ExpediaGroup | Often talking about wine, data and technology
Visualr Software @visualrsoftware
633 Followers 678 Following Data Visualization and Data Analytics Software. Convert raw data into insights. #datavisualization #dataanalytics #BI #MachineLearning #SaaS #datamining
Craig Bloodworth @craigbloodworth
5K Followers 889 Following Dad, CTO @infolabuk, Accidental Coder, Tableau Zen Master Hall of Fame and Local Food Enthusiast
Infographics Online @infographicsdir
926 Followers 4 Following The Infographics Directory is your source for infographics and data visualizations organized by topic and date so you can find relevant and timely infographics.
Visualoop @visualoop
8K Followers 2K Following A community for infographics designers, data journalists and developers.Thanks for dropping by!
Killer Visual Strateg... @killervizcomm
10K Followers 7K Following Killer Visual Strategies is a Seattle-based design agency specializing in infographics, interactive experiences, motion graphics, & more. A Material company.
Best Infographics @InfographicBest
7K Followers 34 Following Collection of the best infographics on the web
Daily Infographic @DailyInfographc
29K Followers 3K Following Here at Daily Infographic, we spend hours searching the internet for the most stimulating, mind-blowing infographics and deliver the best ones to you daily.

Information is Beauti... @infobeautiful
119K Followers 456 Following Data-visualizations & infographics made by David McCandless @mccandelish - app @vizsweet - new project @beautiful__news - https://t.co/oVLj2XZ7nf
Infographics @Infographitweet
23K Followers 4 Following
OpenVis Conf @OpenVisConf
7K Followers 72 Following A two-day (plus workshops) conference about data visualization on the Open Web. Presented by @data_emlyon, tweets by @arnicas.
NASA's Scientific Vis... @NASAViz
42K Followers 539 Following NASA's official Scientific Visualization Studio account, tweeting the best in NASA scientific visualization. We reveal the invisible by bringing data to life.
Matt Francis 💎 @Matt_Francis
9K Followers 985 Following Data Wrangler, Viz Creator, Podcaster, 2024 Tableau Social Ambassador, 2014,2015 Tableau Zen Master, Lover Not Fighter https://t.co/rghSyNwzfW
D3.js Community @d3visualization
11K Followers 494 Following We ♥ D3.js. Official #D3js community account. Curated by Christophe Viau
Tableau Support Team @TableauSupport
10K Followers 111 Following Official Support of @tableau, Tableau Cloud and Tableau Public Status: https://t.co/ECxOV673z3 + Submit a case: https://t.co/lfF6iBiCxd
Machine Learning and ... @ML_NLP
55K Followers 3K Following We share news, discussions, videos, papers, and tutorials related to Machine Learning and NLP. Subscribe on Reddit!
Google DeepMind @GoogleDeepMind
1.2M Followers 279 Following We’re a team of scientists, engineers, ethicists and more, committed to solving intelligence, to advance science and benefit humanity.Trends for United States
You might like