Yan Holtz @R_Graph_Gallery
Software engineer who ❤️ #dataviz. Creator of https://t.co/sj29jZPkYr and the R, Python, D3 and React graph galleries. ➡️ https://t.co/PoJNeHXz8a 📈 🌊 🍺 yan-holtz.com Montpellier, France Joined February 2016-
Tweets2K
-
Followers22K
-
Following674
-
Likes5K
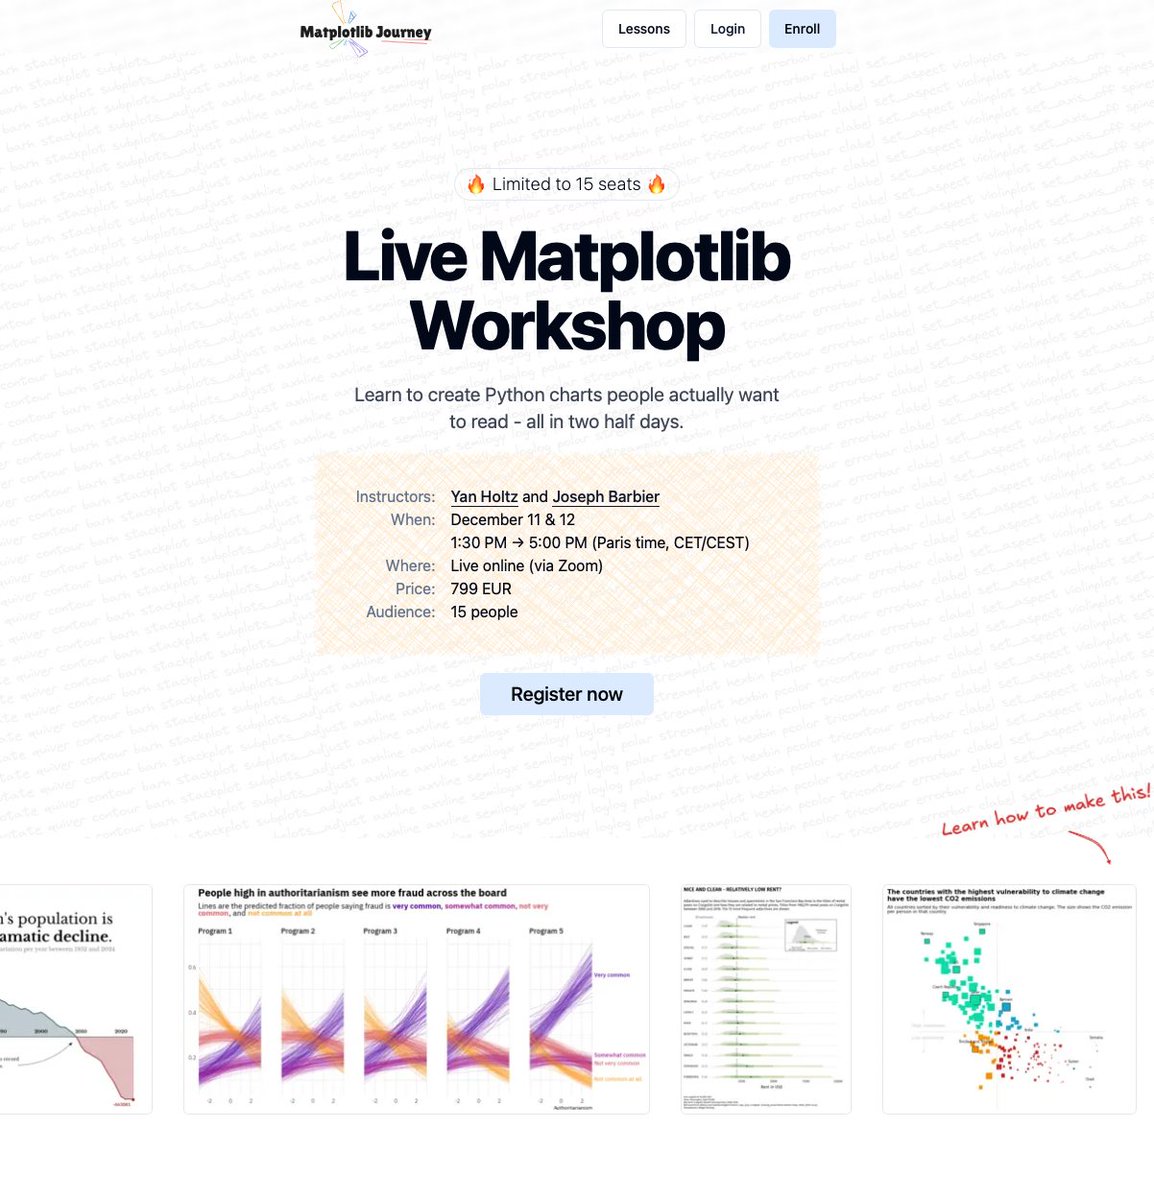
🎉 Want to build better charts with #Python and @matplotlib ? Join me and @joseph_barbier for a brand new #dataviz workshop! We’ll spend 2 half-days together, alternating between impactful explanations and hands-on exercises. Only 15 spots available! matplotlib-journey.com/workshop
Want to improve your #dataviz design eye? ➡️ I just released a little game: You have to spot the better version of a chart and learn the fundamental concepts along the way. matplotlib-journey.com/bonus/design-p… What's your score!? 😀
❌ Made a list of the 37 most common #dataviz caveats - Rank your groups - what's wrong with boxplots - Dual Y axes - overplotting - misleading error bars ... ➡️ lnkd.in/gGC5digF I'll use in my matplotlib-journey.com and ggplot2-uncharted.com Any I should add?


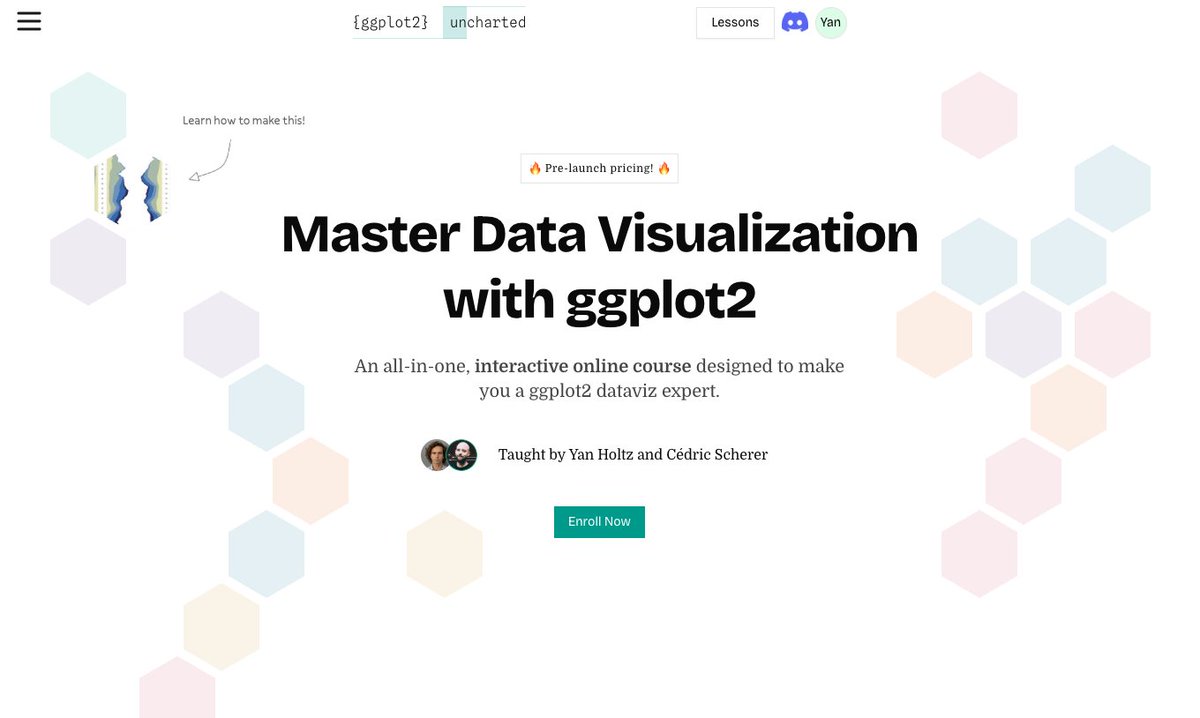
#dataviz is a long, iterative process. If you want to learn the required steps to create a great graph with R and ggplot2, we are building something for you with @CedScherer ! ggplot2-uncharted.com
😀🍾 Big, big news!! 🎉😱 ➡️ I'm starting a new #dataviz project with @CedScherer It's an interactive online course designed to turn you into a ggplot2 dataviz expert! ➡️ ggplot2-uncharted.com Pre-launch until Sunday. If you like making charts with R, you'll love it!
New Python Tutorial: Choropleth + Histogram as a legend with @matplotlib Original work by @Koen_VdE, with Python code written by @joseph_barbier! python-graph-gallery.com/web-choropleth…

🚨 66% of R and Python users do NOT use a formatter 😳 A formatter takes messy code and automatically improves its layout: ✅ Better indentation ✅ Proper spacing ✅ Reasonable line length Poll and explanation in my latest post: 👉 blog.yan-holtz.com

"Python creates only ugly charts" ❌ I wonder how many times I've heard this wrong statement! Matplotlib is very powerful! It's not the most intuitive API, but look what Roy built after investing a few hours in matplotlib-journey.com! Code: github.com/debatreyo/mini…

🎉 10,000 people! 🍾 Every week, I share one short, impactful #dataviz tip in my newsletter. Something you can apply at work the next day. And it looks like people enjoy it: 10k joined in just a year! 😳 Huge thanks to everyone for the feedback 🙏 blog.yan-holtz.com


It's now incredibly easy to build calendar heatmaps! Thanks @joseph_barbier for your dayplot library! Documentation: josephbarbierdarnal.github.io/dayplot/tuto/a… If you like making charts with Python, come learn with us at matplotlib-journey.com!

Chord diagrams are a great way to represent flows. BUT, they become very hard to read when there are too many connections. In this chart, Ansgar Wolsing smartly used small multiples to avoid this trap Love it! ❤️ r-graph-gallery.com/best-r-chart-e…

🍾 Yay! Excited to release a new project! It's a visual exploration of our aging world. It made it to the long list for the Information Is Beautiful Awards! 🚀 Tech stack: React + D3.js, of course ❤️ react-graph-gallery.com/example/popula…
🔥 New Python library for #dataviz! "morethemes" gives your graph a better theme in 1 line of code! It currently offers 10 themes inspired by famous journals such as The Wall Street Journal, andThe Economist. Learn more: lnkd.in/eh5WGt7g Congrats @joseph_barbier !

⏰ Last call! If you want to create stunning charts with Python, there are a 8 hours left only to join Matplotlib Journey! matplotlib-journey.com Thanks so much to the 414 people who joined already! 🙏 Graph by the awesome @CedScherer, python repro by @joseph_barbier
Want to make better charts at work? Only 1 way: 🙇♀️ Practice 🤝 Get feedback ♻️ Repeat! The charts below are a glimpse of what students created in Matplotlib-Journey.com. They use the course Discord to share, get feedback, and refine their code! Only 2 days left to join🚀

Many ppl ask me why I compete with Coursera, Datacamp, Udemy.. But I create very different content! 🎮 Highly interactive 📈 Learn #dataviz AND #coding. Not just one. 👷♂️ Practice for real (like a lot!!) ⛏️ In depth: understand matplotlib for REAL matplotlib-journey.com

Rosana Ferrero 📈�... @RosanaFerrero
51K Followers 5K Following 📊 PhD, Statistics + Data Science + Machine Learning + Biology/Ecol 😉 Stats is the grammar of science 🎓 Directora académica y Docente 🏢 Consultora 💙 #RStats
🔥 Matt Dancho (Bus... @mdancho84
87K Followers 487 Following Future Is Generative AI + Data Science | Helping My Students Become Generative AI Data Scientists & AI Engineers ($200,000+ career) 👇
R Markdown @rmarkdown
29K Followers 431 Following A community of R Markdown enthusiasts posting anything related to #RStats, especially #RMarkdown, #QuartoPub and #Bookdown.
Cédric Scherer @CedScherer
25K Followers 2K Following Inactive account → find me on BlueSky and LinkedIn 🧙♂️✨📊 Independent #DataViz Consultant & Designer 👨🎓🌿🐗 PhD in Computational Ecology
We are R-Ladies @WeAreRLadies
30K Followers 171 Following Rotating Curator for the @RLadiesGlobal community #RLadies (currently on a brief break)
🦋 Tom Mock @thomas_mock
19K Followers 2K Following He/Him | Product Manager @posit_pbc👨💻 I ❤️ Data, 🌮, tables, Quarto, #tidyverse & #RStats | @themockup.blog on BlueSky

Milos Makes Maps @milosmakesmaps
31K Followers 1K Following I paint the world with R and teach you how to unleash your inner map artist. Join my map adventures and tutorials now: ▶️https://t.co/VMqCi7KkGr
R for the Rest of Us @rfortherest
23K Followers 184 Following You don’t need a PhD in statistics or years of coding experience to learn R, the most powerful tool for data analysis and visualization. Made by @dgkeyes.
Jon Schwabish @jschwabish
24K Followers 947 Following 📈Economist & DataViz 🕸@urbaninstitute @PolicyViz 🎙PolicyViz Podcast 📺YouTube step-by-step tutorials 🗞On Substack: https://jschwabish.subst 👀All views mine
Rafael H. M. Pereira ... @UrbanDemog
19K Followers 3K Following Researcher @ipeaonline | Visiting prof @geo_uoft | PhD @TSUOxford | Structured procrastination on Cities, Urban mobility, Accessibility, Equity, Data science, R
Matthias Stahl 🇪�... @h_i_g_s_c_h
5K Followers 4K Following Husband & dad^3 ||| head of data & visualizations @derspiegel ||| #Svelte and #D3 ||| computational biology PhD ||| 🇸🇪🇩🇪🇪🇺 ||| opinions my own
Wendy Shijia @ShijiaWendy
7K Followers 2K Following Data visualization designer, Tableau Visionary & Tableau Public Ambassador
David Keyes @dgkeyes
6K Followers 4K Following Helping the rest of us learn #rstats @rfortherest he/him
Emil Hvitfeldt @Emil_Hvitfeldt
6K Followers 632 Following Going dark until Twitter is a respectable place again.
Estación R @estacion_erre
7K Followers 301 Following Una parada hacia el mundo de los Datos. Cursos | Tips | Recursos | Consultoría y entrenamiento.
Information is Beauti... @infobeautyaward
16K Followers 1K Following The year's finest data visualization & infographics, judged by the public and a panel of 40+ dataviz experts. Presented by @DataVizSociety.
Lisa Charlotte Muth @lisacmuth
32K Followers 669 Following Formerly @lisacrost. Creating & writing about dataviz for @datawrapper. #visber & @datavisclub organizer. Also over there: @[email protected]

Julian Hoffmann Anton @Julian_H0ffmann
7K Followers 4K Following Spatial Data Scientist • Artist • Economist | #ClimateRisk #Dataviz #Maps #3D in London
Raja Raja @RajaRaja1596140
0 Followers 75 Following
Sandip Chaudhary @chaudhary_sndp
89 Followers 2K Following Software developer with 5+ years of experience with a strong background in design.
salahmeskini @salahmeskini
48 Followers 2K Following
icydraws @icydraws
2 Followers 134 Following
jaden rossie @jadenrossie68
300 Followers 387 Following Live 🍀 Love ❤️ Explore 🌏 Advocate for fitness and mental health awareness.
Scott Vitiello @ScottVitie0vnk
4 Followers 138 Following
chrismaral @chrishmaral
0 Followers 15 Following

K.E.M.M.I.E @Judysian
2K Followers 2K Following Engineer 👩🔬 |Woman techstar 26' |Data Science| Cyclist

エビデンスおば... @EvidenceObasan
6K Followers 184 Following 健康情報って難しいわよねぇ…その「エビデンス」ホントにちゃんと意味あるのかしら?? 医療統計を勉強して共有するマスコットおばさんです。怪獣👶育児中 ▶︎ ブログ「🍤エビカツ横丁」https://t.co/BtzgHgh5B8 ▶︎ Youtube 「📝スキマル|スキマ時間で医療統計」@medibook3 氏と共同運営中
siddartha riveros @sidan2791
46 Followers 1K Following
JohnSnowLabs @JohnSnowLabs
45K Followers 30K Following Helping healthcare and life science organizations put AI to work faster with state-of-the-art LLM & NLP.
fuji @fuji_san_noboru
245 Followers 4K Following

sathyaraj kolandasamy @sathyaraj_k
396 Followers 2K Following java addict| technology addict| love food | love movies| gadget freak| father

Ben @kit_connorpriva
29 Followers 285 Following President and Director Construction Service Nature Lover Cat Lover
Ahora zhd @ahorazhd
211 Followers 1K Following a medical Doctor who knows deeplearning (PhD student of AI in medicine)
Grace Efua Amponsah @AmponsahEfua
326 Followers 437 Following Research Assistant @OSU. Agricultural development program Assistant @camfedghana // Licensed Agronomist @EARTH University // Women in Agriculture empowerment

Hassan @msjahids
132 Followers 512 Following ᴋᴀɢɢʟᴇ 2x ɢʀᴀɴᴅᴍᴀꜱᴛᴇʀ ᴅᴀᴛᴀ ꜱᴄɪᴇɴᴄᴇ ᴇɴᴛʜᴜꜱɪᴀꜱᴛ ᴘᴀꜱꜱɪᴏɴᴀᴛᴇ ᴀʙᴏᴜᴛ ᴍᴀᴄʜɪɴᴇ ʟᴇᴀʀɴɪɴɢ
Jkumar @codesncodes
75 Followers 1K Following

Alishba Naseem @AlishbaN82695
2 Followers 68 Following 📚 MS Data Science | #Python | #MachineLearning | #DataScience | #DeepLearning | #AI
Cumlynn Giymer @CGiymer19760
4 Followers 296 Following
Sachin Talagery | س�... @sachin_talagery
87 Followers 4K Following Indiana University '24 🇺🇲🇮🇳🇸🇪 • HLS Int'l Studies + MELC • @iuarabicflagship • «إن سرقت فأُسرق جمل وإن عشقت فأُعشق قمر»
شهد @shmsdss
17 Followers 38 Following Master’s Student in Data Science | Member of @SSDS_ksu | personal space 🌸
Md Shafiuddin Shajib @shafi_shajib
1K Followers 1K Following Software Engineer | Tech Enthusiast | Concerned citizen 🇧🇩
DrSilvaHealth&Tech @DrAntoineSilva
140 Followers 1K Following Emprendedor, dedicado al área de la salud. innovación y tecnología
Mauricio Alessandrell... @MauricioAlessa
0 Followers 2 Following
Scott Paulin @Paulin_Strength
181 Followers 448 Following PhD Researcher on growth, maturation, and performance profiling in sport @ulsterschsport | ASCC | Cycling | Arya 🐕🦺 | @athleticsni pathways coach

Sirkozy @Nicholasirkozy
866 Followers 821 Following |Geospatial Data Analyst|Data Analyst|Businesses Intelligence Analyst|SEO Copywriter|

Imoh Amos @iamimohamos
14 Followers 81 Following Data analyst | BI Analyst | Product Analyst | Data Scientist & AI Enthusiast https://t.co/7So4h6CjFr


Avlawiefud @Avlawiefud6919
12 Followers 856 Following

Marco A. Ozo @Bullin_Thru2k
341 Followers 5K Following “The BULL is not intended to represent fear; but yet to represent the RESILIENCE to overcome the greatest challenges“ Tech - Ai -Inventor- Bizz Dev - Innovate!
Okabe Kuritsu @OkabeKu
106 Followers 199 Following
Random_Statistician @RandomStatisti1
12 Followers 110 Following


JULIANO SEBASTIAN @jsebastiann
23 Followers 742 Following Comunicação, História, Ciência Política, mídia, propaganda e Flamengo.
Rosana Ferrero 📈�... @RosanaFerrero
51K Followers 5K Following 📊 PhD, Statistics + Data Science + Machine Learning + Biology/Ecol 😉 Stats is the grammar of science 🎓 Directora académica y Docente 🏢 Consultora 💙 #RStats
Albert Rapp @rappa753
12K Followers 124 Following 🎓 Math PhD student & freelancer 👨🏫 Bite-sized insights on dataviz, web dev & data science with R at https://t.co/M34b5BzHTD
🔥 Matt Dancho (Bus... @mdancho84
87K Followers 487 Following Future Is Generative AI + Data Science | Helping My Students Become Generative AI Data Scientists & AI Engineers ($200,000+ career) 👇
Cédric Scherer @CedScherer
25K Followers 2K Following Inactive account → find me on BlueSky and LinkedIn 🧙♂️✨📊 Independent #DataViz Consultant & Designer 👨🎓🌿🐗 PhD in Computational Ecology

Nadieh Bremer @NadiehBremer
47K Followers 549 Following Award-winning Data Visualization Designer | Founder of Visual Cinnamon | Graduated Astronomer ✨ | Author of "CHART" & "Data Sketches" | 🇳🇱
🦋 Tom Mock @thomas_mock
19K Followers 2K Following He/Him | Product Manager @posit_pbc👨💻 I ❤️ Data, 🌮, tables, Quarto, #tidyverse & #RStats | @themockup.blog on BlueSky
Federica Fragapane @fedfragapane
20K Followers 972 Following Information designer based in Italy. Works in the Permanent Collection of MoMA 🔗 https://t.co/ggpM8XORDO

Tyler Morgan-Wall @tylermorganwall
24K Followers 181 Following R, data science, dataviz, maps, raytracing. Developer of rayshader, rayrender, and the rayverse | PhD in Physics | @Penn
Milos Makes Maps @milosmakesmaps
31K Followers 1K Following I paint the world with R and teach you how to unleash your inner map artist. Join my map adventures and tutorials now: ▶️https://t.co/VMqCi7KkGr
Jon Schwabish @jschwabish
24K Followers 947 Following 📈Economist & DataViz 🕸@urbaninstitute @PolicyViz 🎙PolicyViz Podcast 📺YouTube step-by-step tutorials 🗞On Substack: https://jschwabish.subst 👀All views mine
Matthias Stahl 🇪�... @h_i_g_s_c_h
5K Followers 4K Following Husband & dad^3 ||| head of data & visualizations @derspiegel ||| #Svelte and #D3 ||| computational biology PhD ||| 🇸🇪🇩🇪🇪🇺 ||| opinions my own
Indrajeet Patil (इ�... @patilindrajeets
7K Followers 6 Following Follow me on LinkedIn, where I'm more active: https://t.co/Urols0wxwX
Cole Knaflic @storywithdata
35K Followers 726 Following Helping people make great graphs & present powerfully. Bestselling author of #SWDbook #SWDbeforeandafter #daphnedrawsdata #storytellingwithyou #SWDletspractice
Shirley Wu @sxywu
31K Followers 687 Following chinese-american artist, software engineer, dataviz designer, keynote speaker, published author && a work-in-progress learning to take up space ✨
Emil Hvitfeldt @Emil_Hvitfeldt
6K Followers 632 Following Going dark until Twitter is a respectable place again.
Antonio Sánchez Chin... @aschinchon
4K Followers 1K Following Preauricular sinus. Working at @MovistarPlus
Evelina Parrou @parabolestudio
4K Followers 744 Following Data storytelling for mission-driven orgs 🎯 Founder of Parabole Studio 📡 Free newsletter 👉 https://t.co/eHlVFf0aVZ

Michael · Design Par... @MichaelFilipiuk
37K Followers 317 Following Designer @Wander · I partner with startup founders to design fantastic websites and apps. Got a project in mind? https://t.co/HLDwIbJO5R
Jan Broder Engler @JanBroderEngler
4K Followers 998 Following Scientist and software developer. Creator of https://t.co/jhDLNRoZqB.
Clara Dealberto @claradealberto
21K Followers 976 Following Responsable infographisme @LePoint, passée par @libe @lemondefr @we_do_data // 50% de @GoumProd // J’aime beaucoup les cartes // Derrière @LittleBigData_
https://bsky.app/prof... @tmcw
14K Followers 2 Following not using twitter anymore. https://t.co/PtubFCpGBJ https://t.co/ZckGEmD0Ob https://t.co/Bq05CWsrnj
Bertha Rohenkohl @BerthaRohenkohl
433 Followers 944 Following Not posting on this account anymore. You can find me on LinkedIn or Bluesky. PhD | Research and Data Economics Lead @OurWorldInData | Views my own.
Vakita @vakitamedia
25K Followers 44 Following Le nouveau média d’enquête et d’action💥 Vous alertez, nous enquêtons ! 👊 Abonnez-vous sur le site pour nous soutenir et voir nos vidéos complètes ⬇️
Buried Signals @buriedsignals
2K Followers 1K Following Visual journalist based in 🇨🇭 reporting on data-driven stories with maps and charts.
Zander Whitehurst @zander_supafast
134K Followers 27 Following Founder @memorisely • https://t.co/xSoNEdvmxz | Educator Advisory Board @figma | Making UX/UI education accessible ⚡️

Defakator 🧆Officie... @DEFAKATOR_Off
105K Followers 429 Following Outils pour défaker sur les fakes, sur YT et Twitch. On peut désormais me suivre sur d'autres plateformes.


Mike Driscoll @driscollis
131K Followers 978 Following Python Book author, blogger, and more @ThePSF #Python

Laura Navarro @LauraNavarroSol
3K Followers 1K Following Periodista de datos|visual. Antes, en @el_pais y @newtral. Aprendí en @StorydataBcn. De Barna. 📊
Giandomenico Bisaccia... @bisacciaMD
212 Followers 693 Following MSc student @LSEHealthPolicy | MD-PhD @UnivUda | #WhyCMR fellow @RBandH
Luka Negoita, PhD @lukanegoita
6K Followers 831 Following Ecologist and Data Scientist | Teacher of courses on #Rstats for ecologists | He/Him | My tweets are my own

Jacob Scott @_wurli
584 Followers 391 Following software developer // data scientist // #rstats enthusiast // musician // also on Mastodon I guess 🤷 @[email protected]
Joseph @joseph_barbier
692 Followers 44 Following I'm a freelance data scientist - living in France 🥖 - doing open source 🐍 - and data visualization 📈

Lino Galiana @LinoGaliana
445 Followers 891 Following Data scientist @InseeFr • Teaching @ENSAEparis #Python and #Rstats • Loves #dataviz • Also on mastodon : https://t.co/ABYZvsxKw9
David Carayon @david_carayon
49 Followers 102 Following Statistician @ French National Research Institute for Agriculture, Food and the Environment (@INRAE_NA_BDX)
2COConference @2COConference
281 Followers 534 Following Communicating Complexity International Design Conference on Informative-Animation, Interactive data visualization and Info-graphics

elizabeth lin 🦄✨ @lalizlabeth
5K Followers 965 Following 👑 independent designer and educator building an alternative design school: prototyping with cursor and the art of visual design. learn more~
Ansgar Wolsing @_ansgar
2K Followers 1K Following Powerpoint by day, #ggplot2 by night. #rstats #dataviz ░D░A░T░A░V░I░Z░░I░N░░B░I░O░

dieghernan ن @dhernangomez
607 Followers 384 Following Actualidad, economía y finanzas. Y buen humor que no falte.
Pawel Jastrzebski �... @pawjast
2K Followers 479 Following Data analyst with 🐍 | Turning data to 🖼 with @matplotlib and @inkscape | Sharing tips on data analysis & coding | Learning Flask and Linux - Let's connect🌍
Nick Strayer @NicholasStrayer
5K Followers 344 Following Engineer on the Shiny team at @posit_pbc. I write code with #javascript/#typescript to help people write code in #rstats and #python
Mike Freeman @mf_viz
4K Followers 923 Following Data Visualization Software Engineer: working to make visualization more accessible, equitable, and impactful. Views are my own. He/him.
juweek @juweekbro
701 Followers 1K Following artist coder who specializes in data and interaction. ex @npr @guardian
terence @researchremora
40K Followers 937 Following smitten with #rstats · the #rayverse's number one fan
Jan Kühn @derjaku
333 Followers 367 Following Data Scientist & Data Visualization Designer (@[email protected], bsky: @yotka.org)
shadcn @shadcn
186K Followers 354 Following I own a computer / Working on https://t.co/JtIdM7EjBL & https://t.co/5FRvxujR8x / Currently @vercel.
nanda @nandafyi
18K Followers 371 Following teaching svgs @ https://t.co/0dCAARwEbE | writing about computers and stuff @ https://t.co/CttP8HVN9k
Nina Clapperton (She ... @NinaClapperton
10K Followers 630 Following 🧠 SEO and Travel Blogger since 2018. 💰 Making $30k/mo from one travel blog. 📈 Over 7,500 students and clients served. 💎Get my free SEO Content Audit Guide👇
Peter McKeever @petermckeever
15K Followers 1K Following Making viz go brrrrrrr for @OptaAnalyst. 🇮🇪➡️🇩🇪. Dad²

Huyen N. Nguyen @huyendoesstuff
182 Followers 338 Following Postdoc @HarvardDBMI | @HarvardMed. Data visualization & biomedical informatics. 🦋 https://t.co/g4Hy2VD0yo
Stat'Apprendra @SApprendra
92 Followers 130 Following Stat'Apprendra, la chaîne qui te permet de ne plus avoir peur des statistiques et qui va peut-être même te donner une folle envie d'analyser des données.


Julia Han Janicki �... @jhjanicki
1K Followers 913 Following Data journalist, dataviz design + dev. interested in animal / human rights, environment, science + tech #TaiwanDataStories 🇹🇼🇺🇸🇯🇵🇫🇷🇬🇧
George Stagg @gwstagg
1K Followers 196 Following Software Engineer. Mathematician. I like making things.Trends for United States
You might like