Datawrapper @Datawrapper
Enrich your stories with charts, maps, and tables – interactive, responsive, and on brand. Questions? Write us: [email protected] datawrapper.de Berlin, Germany Joined February 2012-
Tweets5K
-
Followers27K
-
Following619
-
Likes6K
Ever wonder what our support team gets up to, and what chart types they use the most? Our colleague Shaylee set out to answer those questions for herself. 📊 💌 datawrapper.de/blog/charting-…
There are different kinds of maps that you can create in Datawrapper. But which one should you use for which type of data and for which use case? In this tutorial, you'll learn how to pick the one that goes best with your data: 📹 youtu.be/upnbAsc-rhU

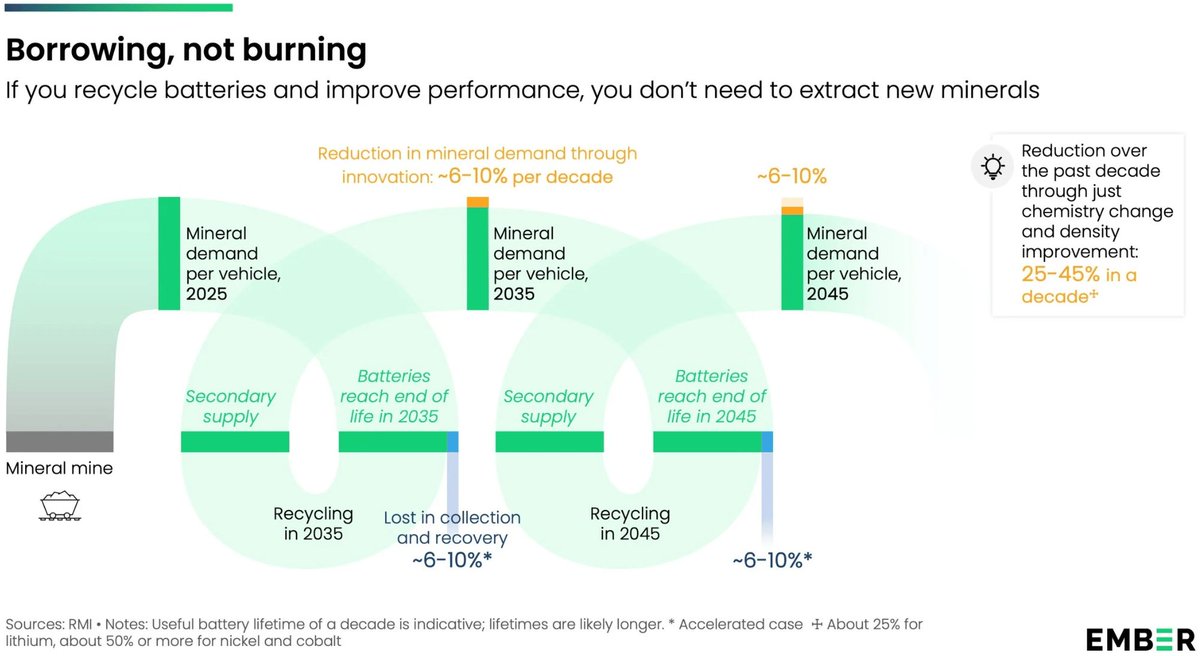
In this week's Dispatch, you'll find data vis on politics, trains, and minerals, but also interactive tools to explore, and yet another data game at the end. 📊 🕹️ datawrapper.de/blog/data-vis-…

This week, our designer Gustav takes a critical look at green spaces in German cities and the reasons why not all parks are as public as they seem. 🌳 👀 datawrapper.de/blog/public-gr…
This week's Dispatch brings a range of topics — U.S. politics, gender issues, the economy, conflict, and climate — as well as a chart-themed game at the end. 📊 🕹️ datawrapper.de/blog/data-vis-…


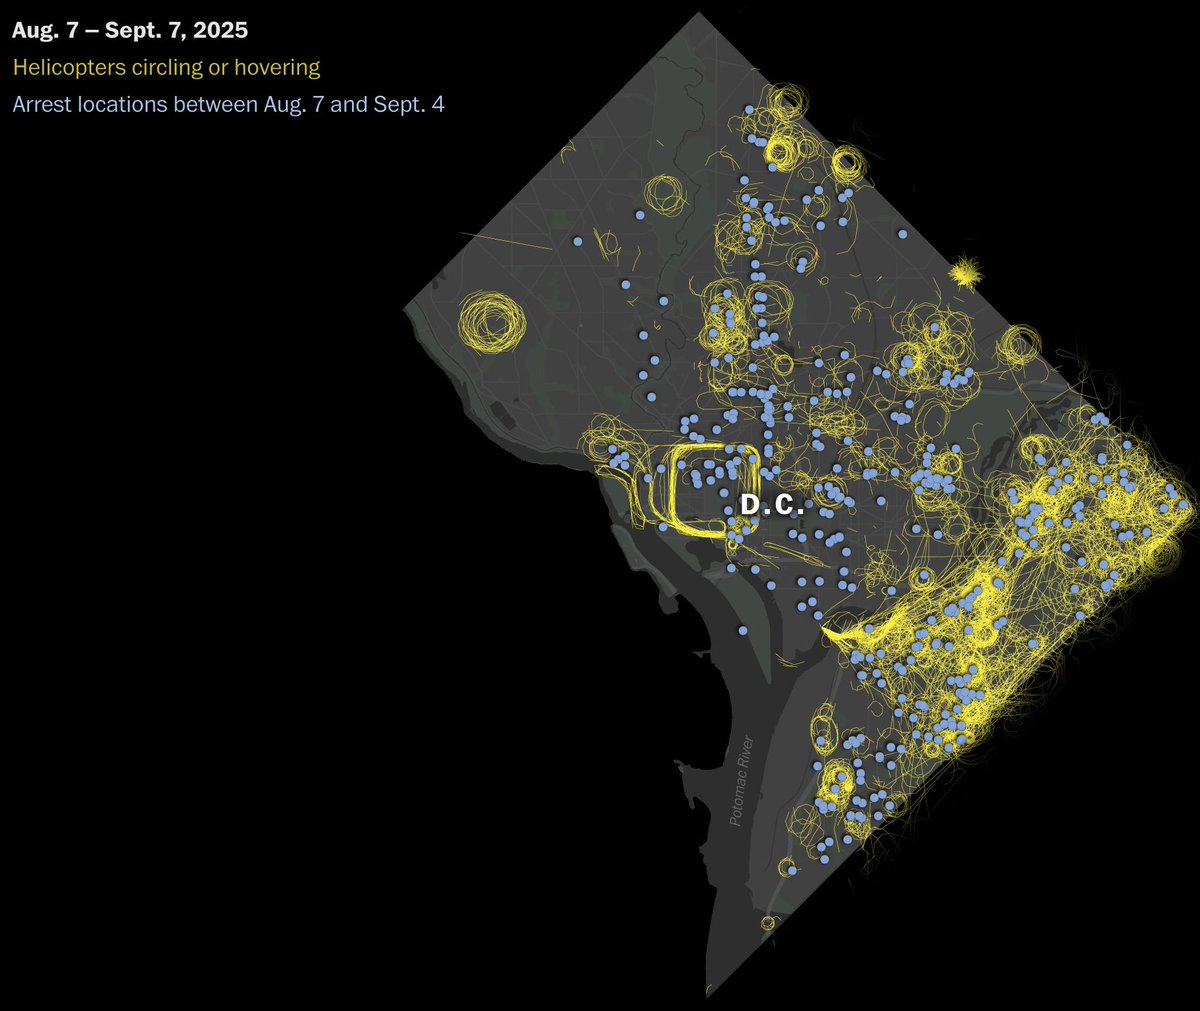
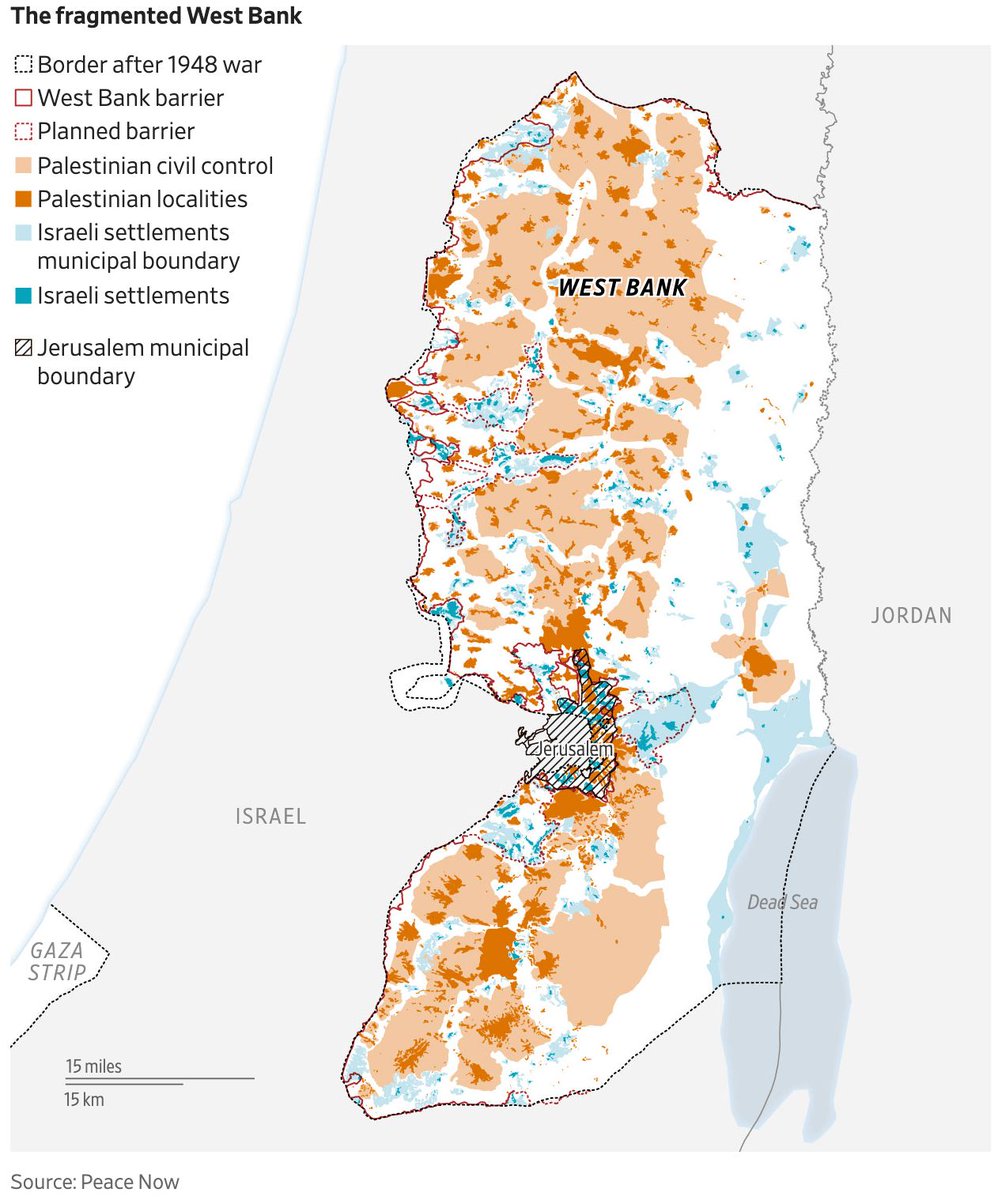
This week, our co-founder Gregor helps us make sense, or at least get a clearer picture, of the scale of destruction in the streets of Gaza. 🗺️ datawrapper.de/blog/mapping-d…
There are different kinds of maps that you can create in Datawrapper. But which one should you use for which type of data and for which use case? In this tutorial, you'll learn how to pick the one that goes best with your data: 📹 youtu.be/upnbAsc-rhU
📊 The Dispatch is here! This week's visualizations feature China's military parade, climate change impacts and solutions, and much more. 🗞️ datawrapper.de/blog/data-vis-…


🎉 New: Introducing workspaces! Workspaces bring all your Datawrapper teams and charts under one roof, making it easy to collaborate within an organization and manage preferences, members, and subscriptions. Read on to learn how workspaces can help your teams! 💫…
Our recent move to a new office was good news for our co-CEO David's commute time! In his Weekly Chart, he explores what a "normal" German commute looks like. 🏢 🚶 datawrapper.de/blog/commuting…
💡 New to Datawrapper or wondering if it’s the perfect fit for your projects? There's still time to join today's webinar! Happening at 12pm EDT / 6pm CET, we’ll cover everything you need to know to get started. Don’t miss out—secure your spot here 👇 streamyard.com/watch/W5dzprKi…
From the political slant of large language models (and the people who make them) to a week of uncertainty in French government — this week's Data Vis Dispatch has it all in pictures! 📈 datawrapper.de/blog/data-vis-…


Mozart learned to read music before actual words. No wonder he had an exceptionally productive musical career. In her Weekly Chart, our product specialist Guillermina looks into the life of the legendary composer. 🎶 🎼 datawrapper.de/blog/mozart-pr…
Mini line charts? Country flags? Custom highlights? Yes! You can do all that in a Datawrapper table. 🤩 In this video, you'll learn how to turn raw data into a clean, interactive, and visually engaging table: youtu.be/kdYSPjBKfSA

Learn about debatable maps and discover charts on energy, heat, politics, and more in this week’s edition of the Data Vis Dispatch! 📊 datawrapper.de/blog/data-vis-…


You just signed up to Datawrapper and opened it for the first time? In this beginner-friendly video, we'll give you a first tour through Datawrapper. 📹 You can watch it here: youtu.be/PD05sm52v1I
This week, our visualization engineer Luc dives into the concept of dissonance. Time to dust off your knowledge of music theory (and maybe physics too), or get ready to learn! 🤓 🎶 datawrapper.de/blog/visualizi…
🌇 Learn all about the weather and it’s consequences (both good and bad) in our latest Data Vis Dispatch. You’ll also find charts about sports, migration, and AI in there! 📊 datawrapper.de/blog/data-vis-…


🔍 New to Datawrapper or curious about its features? Join us next Tuesday (August 26) for an introductory webinar at 12pm EDT / 6pm CET! Learn how to get started and see if it’s the right tool for your data projects. You can sign up here 👇 streamyard.com/watch/W5dzprKi…
🤩 The book club is starting in just 5 minutes! Join the discussion here: notes.dw.tools/p/chart Not able to join? No worries! You'll still have access to the discussion and the book club information here 👇 datawrapper.de/blog/chart-nad…

Nadieh Bremer @NadiehBremer
47K Followers 549 Following Award-winning Data Visualization Designer | Founder of Visual Cinnamon | Graduated Astronomer ✨ | Author of "CHART" & "Data Sketches" | 🇳🇱
Federica Fragapane @fedfragapane
20K Followers 972 Following Information designer based in Italy. Works in the Permanent Collection of MoMA 🔗 https://t.co/ggpM8XORDO
Lisa Charlotte Muth @lisacmuth
32K Followers 669 Following Formerly @lisacrost. Creating & writing about dataviz for @datawrapper. #visber & @datavisclub organizer. Also over there: @[email protected]
Data Visualization So... @DataVizSociety
79K Followers 313 Following We are dedicated to fostering community for data visualization professionals. Follow us on Bluesky: https://t.co/mQkiZ5ZPhd
Cédric Scherer @CedScherer
25K Followers 2K Following Inactive account → find me on BlueSky and LinkedIn 🧙♂️✨📊 Independent #DataViz Consultant & Designer 👨🎓🌿🐗 PhD in Computational Ecology
Yan Holtz @R_Graph_Gallery
22K Followers 674 Following Software engineer who ❤️ #dataviz. Creator of https://t.co/sj29jZPkYr and the R, Python, D3 and React graph galleries. ➡️ https://t.co/PoJNeHXz8a 📈 🌊 🍺
JasonForrest @Jasonforrestftw
7K Followers 906 Following https://t.co/tUp3q8hKog Ex-McKinsey, Editor-in-chief of Nightingale, Electronic Musician. https://t.co/6OqWYBSdhy
Kevin Flerlage @FlerlageKev
17K Followers 3K Following Tableau Evangelist/Data Visualization Consultant at Moxy Analytics | Hall of Fame Tableau Visionary | 6X Tableau Public Ambassador | Half of the Flerlage Twins
Jon Schwabish @jschwabish
24K Followers 947 Following 📈Economist & DataViz 🕸@urbaninstitute @PolicyViz 🎙PolicyViz Podcast 📺YouTube step-by-step tutorials 🗞On Substack: https://jschwabish.subst 👀All views mine
Matthias Stahl 🇪�... @h_i_g_s_c_h
5K Followers 4K Following Husband & dad^3 ||| head of data & visualizations @derspiegel ||| #Svelte and #D3 ||| computational biology PhD ||| 🇸🇪🇩🇪🇪🇺 ||| opinions my own
Information is Beauti... @infobeautyaward
16K Followers 1K Following The year's finest data visualization & infographics, judged by the public and a panel of 40+ dataviz experts. Presented by @DataVizSociety.
Cole Knaflic @storywithdata
35K Followers 726 Following Helping people make great graphs & present powerfully. Bestselling author of #SWDbook #SWDbeforeandafter #daphnedrawsdata #storytellingwithyou #SWDletspractice
Tristan Guillevin @ladataviz
6K Followers 471 Following △ Simplifying your data visualization workflow: https://t.co/bhhqfCdjl5 ▲ @figma to @tableau plugin: https://t.co/wcVhHuwnIb △ Weekly news: https://t.co/fFtiLoGo49
Wendy Shijia @ShijiaWendy
7K Followers 2K Following Data visualization designer, Tableau Visionary & Tableau Public Ambassador
Tableau Public @tableaupublic
71K Followers 1K Following Share, create, and explore @Tableau data visualizations for free on Tableau Public. For more inspiration, view our #VizOfTheDay and connect with our #DataFam ❤️
Pradeep Kumar G @pradeep_zen
7K Followers 849 Following Tableau Public Ambassador (6x) • #IronViz '21 Finalist • Vizzie Awards (2x) • #VizOfTheDay (14x) • #IIBAwards '22 Bronze • 2nd Most Favorited Author on TP
Alex Selby-Boothroyd @AlexSelbyB
22K Followers 4K Following Head of data journalism at The Economist. Find me at Bluesky https://t.co/qvM83E9mfY
Neil Richards @theneilrichards
8K Followers 1K Following Tableau Visionary Hall of Fame & Public Ambassador | Global Data Fluency @JLL | https://t.co/q1nvEnM4QD | Questions in Dataviz book released Nov 2022
Krisztina Szűcs @szucsi
5K Followers 412 Following https://t.co/hAZGXA6Utq • Data Visualization Designer • Experimental projects at https://t.co/YuB3h3GWk3 • occasional UX Designer
Andy Kriebel @VizWizBI
33K Followers 2K Following Global Head Coach @ The Data School | Tableau Visionary HOF | Training the next generation of great data analysts. Tweets & threads to help you be great too.
o @kevtwts
1 Followers 245 Following
Lawrence #Geospatial�... @lawrence_kim_
3K Followers 3K Following #Geospatial & Remote Sensing | G.I.S developer | Vue JS | Python | R | #ArcGIS | #earthengine | AI/ML | #gischat
Hilda Poon @hldpn
439 Followers 695 Following News junkie and media nerd in Hong Kong | @jmschku alum | Tweets about data, media and LGBT+ | Opinions are my own
Graham Hawes @PVofFCF
3K Followers 419 Following
Mazin Raoof Mohammed ... @mazintheds
0 Followers 894 Following A Data Scientist and a British Council Certified Agent, CEO/Founder of Dyla Academic Services LTD.

Nindia @hello_nindia
211 Followers 803 Following
Ftm @ftmacrt
2 Followers 51 Following
WillPer @wilpertwitt
107 Followers 849 Following
Juan Navarro @Juan_FNG
49 Followers 424 Following 🇲🇽Electrical engineer / 📸Photography enthusiast / Freedom lover.
Carlota Urruela @CarlotaUrruela
472 Followers 230 Following Associate Professor at the Norwegian Police University College. Crime Analysis and Prevention. Data Visualisation, Cybercrime and Differential Psychology.
Moses Mwania @Moses__Mwania
1K Followers 223 Following GIS 🌍| Remote Sensing (EO)🛰️ | GIScience | 🇰🇪

Nathan Ruser @Nrg8000
134K Followers 4K Following Picking quarrels and provoking trouble (寻衅滋事) 🎵I'm working late, cause I'm a mapper 🎵 Analyst at @ASPI_org
Ⓢ. Ⓜ. Ⓟⓐⓡ�... @smrana86032730
23 Followers 838 Following Express thyself is the best tool for every success or failure
Valu @vl3dda
1 Followers 96 Following
WaggJC @WangJC23
5 Followers 33 Following
Alisha Davis @a24davee
31 Followers 1K Following
Insha Kanue @InshaKanue
586 Followers 2K Following Kashmiri🍁| Product - Data & AI Tech | at the intersection of Tech, Biz & Impact | Digital nomading 🇩🇪🇳🇱🇧🇪🇱🇺🇫🇷🇻🇳🇦🇪🇨🇿🇹🇭🇮🇳
David Will @_David_Will
318 Followers 1K Following Volo bei ZEIT ONLINE. Davor freier (Daten-)Journalist in Berlin. Hat Politik- und Kulturwissenschaften in Leipzig studiert. Texte: https://t.co/ugmLWvc2Rc
hs珑 @hslonglxl
1 Followers 112 Following
Richard Dune @DrRichDune
1K Followers 2K Following Educator. EdTech. eLearning. LMS. L&D. Regulatory Compliance. Governance & Workforce Development. CDSS. - Views my own.
Carl Voigt @cvoigt_
121 Followers 1K Following
paderborn ultra @schwulen_ikone
0 Followers 9 Following .𖤣𖥧𖡼.𖤣𖥧𖡼.𖤣𖥧𖡼. .𖤣𖥧𖡼.𖤣𖥧𖡼.𖤣𖥧𖡼. .𖤣𖥧𖡼.𖤣𖥧𖡼.𖤣𖥧𖡼. .𖤣𖥧𖡼.𖤣𖥧𖡼.𖤣𖥧𖡼. .𖤣𖥧𖡼.𖤣𖥧𖡼
Dave McClure @davemcclure
335K Followers 21K Following founder: https://t.co/A4xpEYhG0F https://t.co/MzzgOOPPi6 https://t.co/WwbH5XZfSY | a very bad VC secondary podcast: @TradingVCs | alum: JHU PayPal Founders Fund | fanboi: Dr Seuss Muppets Sesame St
geosky | spatial anal... @geoskydev
6 Followers 133 Following geospatial automation • web visualization • data-driven solutions
Phil Dickinson @PhilDickin9764
2 Followers 234 Following Associate Dean, College of Arts & Sciences. Teaching Professor, Dept. of English. Sometime writer, collagist, drummer, & music maven. Stymied archivist.
Martin Dean @MartinDean1986
178 Followers 492 Following
Sergio @sergpato4
7 Followers 86 Following

Sonda @sondavolume
120 Followers 6K Following
Arkouooqaq @Arkouooqaq4503
15 Followers 824 Following
Coach Mellisa @YourFriendlyXer
18 Followers 240 Following Two business Holder. I deal on graphics design, Affiliate marketing and web development. A certified one at that 💯Come and let's make the impossible possible😊
JULIANO SEBASTIAN @jsebastiann
23 Followers 742 Following Comunicação, História, Ciência Política, mídia, propaganda e Flamengo.
Madhusmita @Madhusmita_M17
9 Followers 140 Following PhD Scholar | UGC NET SRF | IIRS Dehradun | Forestry | Environmental Science | Forest Fire | Climate Change
Joy Saha @joysaha365
78 Followers 809 Following Award-Winning Photographer & Visual Journalist | Human & Environmental Stories | Oxford Climate Journalism Network 👨🎓 📩 [email protected]
James Waldorf @james_waldorf7
54 Followers 1K Following
Franz @vas_franz
0 Followers 96 Following
Adam Abdullahi @DrAdamAbdullahi
1K Followers 741 Following Outbreak Science and Health Systems thinker, @MedCambridge , @HarvardChanSPH and @WHO. 2025 ELBI Fellow @BSPH_CHS. Striving-golfer.

Amit Gupta @AmitGupta63282
428 Followers 8K Following संविधान है तो हक़ है, अन्याय के ख़िलाफ़, संविधान की रक्षा ही देश की रक्षा है, बाकी सब खोखले नारे हैं।
Rossimus Maximus @RossimusMaximus
71 Followers 2K Following
Serçiya^ سەرچی�... @Sarchia_
1K Followers 478 Following /sɛrtʃɪjɑː/ — Interested in Languages, Engineering, Data, and Design. « Milet berhema eqlê xwe dixwin »
HtiekHtiek @copypastebahasa
51 Followers 4K Following Bio, di sini tertera "tolong rasa bebas hantar ancaman bunnuh dan spam untuk menguji sama ada akaun ini adalah robot ataupun manusia." .
Eva @Eva049195445185
8 Followers 18 Following
threemany @three_many
3 Followers 10 Following
Andrew @sandreyw
57 Followers 2K Following
Nadieh Bremer @NadiehBremer
47K Followers 549 Following Award-winning Data Visualization Designer | Founder of Visual Cinnamon | Graduated Astronomer ✨ | Author of "CHART" & "Data Sketches" | 🇳🇱
Federica Fragapane @fedfragapane
20K Followers 972 Following Information designer based in Italy. Works in the Permanent Collection of MoMA 🔗 https://t.co/ggpM8XORDO
Lisa Charlotte Muth @lisacmuth
32K Followers 669 Following Formerly @lisacrost. Creating & writing about dataviz for @datawrapper. #visber & @datavisclub organizer. Also over there: @[email protected]
Jon Schwabish @jschwabish
24K Followers 947 Following 📈Economist & DataViz 🕸@urbaninstitute @PolicyViz 🎙PolicyViz Podcast 📺YouTube step-by-step tutorials 🗞On Substack: https://jschwabish.subst 👀All views mine
Matthias Stahl 🇪�... @h_i_g_s_c_h
5K Followers 4K Following Husband & dad^3 ||| head of data & visualizations @derspiegel ||| #Svelte and #D3 ||| computational biology PhD ||| 🇸🇪🇩🇪🇪🇺 ||| opinions my own
Information is Beauti... @infobeautyaward
16K Followers 1K Following The year's finest data visualization & infographics, judged by the public and a panel of 40+ dataviz experts. Presented by @DataVizSociety.
Tableau Public @tableaupublic
71K Followers 1K Following Share, create, and explore @Tableau data visualizations for free on Tableau Public. For more inspiration, view our #VizOfTheDay and connect with our #DataFam ❤️
Post Graphics @PostGraphics
67K Followers 78 Following Graphics, visualizations and maps from The Washington Post.
Alex Selby-Boothroyd @AlexSelbyB
22K Followers 4K Following Head of data journalism at The Economist. Find me at Bluesky https://t.co/qvM83E9mfY
Neil Richards @theneilrichards
8K Followers 1K Following Tableau Visionary Hall of Fame & Public Ambassador | Global Data Fluency @JLL | https://t.co/q1nvEnM4QD | Questions in Dataviz book released Nov 2022
Shirley Wu @sxywu
31K Followers 687 Following chinese-american artist, software engineer, dataviz designer, keynote speaker, published author && a work-in-progress learning to take up space ✨
Alli Torban @AlliTorban
9K Followers 892 Following 📕 Author of Chart Spark 📊⚡Information Designer and Senior Data Literacy Advocate 🎙 host Data Viz Today podcast


Topi Tjukanov @tjukanov
20K Followers 2K Following Makes maps. Works at @Mapbox. Started #30DayMapChallenge.
Ben Jones @DataRemixed
14K Followers 3K Following Founder & CEO @dataliteracycom, author of Data Literacy Fundamentals https://t.co/5j23m0lirz & Learning to See Data https://t.co/WilvUprjpB. Love nature over tech
Julius Tröger @juliustroeger
10K Followers 1K Following Ressortleiter Daten und Visualisierung | Head of Data and Visualization @zeitonline | Autor @rowohlt @dudenverlag
RJ Andrews @infowetrust
10K Followers 420 Following IS MAKING DATA STORIES https://t.co/OxrRVULowC and publishing information graphics at https://t.co/wgAsd9evv3
Bloomberg Graphics @BBGVisualData
79K Followers 171 Following Graphs, maps and data journalism from the Bloomberg Graphics team.

Vivien Serve @serve_vivien
16 Followers 49 Following Interfacedesign student at FH Potsdam. Co-Founder Sæx Fashion GbR.
Megan Lavey-Heaton @savvyliterate
4K Followers 1K Following Meg • she/her/they • co-creator Namesake w/ @secondlina • @PennLive social media/data/podcasts • books/store @Hiveworks • fangirl & crafty
taz Klima @tazKlima
12K Followers 184 Following 🌍 Alles zur Klimakrise aus der @tazgezwitscher ⬇️ Schaut mal bei uns auf Insta vorbei ⬇️
The Data Vis Book Clu... @datavisclub
8K Followers 332 Following The @datawrapper book club lives on – but this account won’t. Subscribe to our newsletter to keep reading with us: https://t.co/OqePIAWw7I
Rose Mintzer-Sweeney @rosemintzers
704 Followers 99 Following words 🤝 numbers 🤝 pictures | writer @datawrapper
Aya @ayatnkw
137 Followers 411 Following

Edurne Morillo @EdurneMG
2K Followers 3K Following Data Journalist | Australia and Pacific correspondent @EFEnoticias ✍️ | Before, product specialist at @Datawrapper 📊 and @EFEafrica | [email protected] 📩

Zoho Social @ZohoSocial
110K Followers 184 Following #SocialMediaManagement software for businesses and agencies. Part of the @Zoho suite.
Social Champ @SocialChampSays
14K Followers 1K Following We automate, analyze, and amplify your content across all major platforms, so you can go slay social media without losing your mind (or your weekend).
On Our Radar @OnOurRadar
5K Followers 3K Following We are an award-winning media organisation supporting unheard communities to share stories from across the globe.
Emilia Smechowski @emilia_owski
6K Followers 2K Following Chefredakteurin @ZEITmagazin, Autorin von "Wir Strebermigranten" und "Rückkehr nach Polen" @hanserliteratur

suman karanam @suman_karanam
72 Followers 417 Following Dreamer, Nomad,Lifetime learner, @DataArchitect by Profession
zach lieberman @zachlieberman
93K Followers 1K Following I make art with code https://t.co/tmbcblT10q https://t.co/dTly4dGZHP https://t.co/tsUFnxvVZ5 https://t.co/0WD22DIJlo https://t.co/HVwcOYTP33 email: zach at https://t.co/dTly4dGZHP
Nikos Drandakis @drandakis
8K Followers 494 Following Curious entrepreneur and investor. Techno optimist. Taxibeat founder, exited to Daimler. Chief Host at Sync Car Rentals Marketplace.
Anna Freeland @annamareefree
747 Followers 2K Following Features Editor @SBSNews; former arts journo @abcnews & data fellow @GoogleNewsInit; fed council delegate @withMEAA
World Economic Forum @wef
4.4M Followers 957 Following The international organization for public private cooperation. #wef25
Amelia Wattenberger �... @Wattenberger
33K Followers 5K Following ☁️☀️ please come visit on the other app ☀️☁️ design, LLMs, web dev, data viz, tools for thought ✨ @shv, previously R&D @GitHubNext, design @AdeptAILabs
Übermedien @uebermedien
85K Followers 203 Following Das Medienmagazin. Jetzt unterstützen: https://t.co/SLJlwVGPAd 🐘 @[email protected]
chekos @ChekosWH
1K Followers 2K Following data rules everything around me. sophisticated ironist #blacklivesmatter. data engineer. @tacosdedatos | smol policy bb | host de @LoQueAndoOyendo
Tariq Khokhar @tkb
10K Followers 8K Following Head of Data for Science & Health @wellcometrust. Chair of @DataKindUK. Board of @uk_biobank. Science, tech, econ & design nerd. Ex @RockefellerFdn & @worldbank
James Gunn @JamesGunn
1.9M Followers 1K Following I like people to know when I'm drinking coffee, so I joined Twitter. IG & Threads: jamesgunn BlueSky: https://t.co/Xy5jTOkmGD
John Alexis Guerra G�... @duto_guerra
3K Followers 973 Following 🇨🇴@guerravis Associate Teaching Professor @Northeastern CA. @KhouryVIS member Research on #dataviz #a11y Co-creator @btactile https://t.co/5qoQupwRtJ @duto_iris
HORIZONT @Horizont
44K Followers 2K Following Die aktuellsten News aus Marketing & Medien. Datenschutz https://t.co/cxBTiyVfTK…, Impressum https://t.co/9y9BTdPxmK…
turi2 @turi2
42K Followers 2K Following
🚫⛔️jAaj Bä¶�... @janboehm
2.7M Followers 2K Following 💩// LEAVE AND JOIN MASTODON: https://t.co/DKRwnXaBgO // https://t.co/WOsvPvpR0S /// 💩

MEEDIA @MEEDIA
96K Followers 441 Following MARKEN. MEDIEN. MACHER:INNEN. - Mehr Infos via https://t.co/xRyzyMY76I
ZAPP Medienmagazin @ZappMM
74K Followers 535 Following Der kritische Blick auf die Medien | @NDR Jetzt auch auf Bluesky: @zapp.ndr.de
ZDF heute-show @heuteshow
1.6M Followers 11 Following Nachrichtensatire mit Oliver Welke: Freitags im @ZDF, täglich im Netz. #heuteshow | Impressum: https://t.co/WlGJd9pIcY | offizielle ZDF-Accounts: https://t.co/4w6Qp5EeLb
Jamila Schäfer @jamila_anna
28K Followers 2K Following Bundestagsabgeordnete für #München-Süd und Landesgruppenchefin der @gruenebayern 🌻| 💶Haushaltsausschuss | 🌎 Auswärtiger Ausschuss
Rosina Gammarano @RGammarano
261 Followers 135 Following Uruguayan Economist and Labour Statistician @ONUMX, focused on promoting sustainable development everywhere. Tweets and retweets reflect my personal views.
Dayyan Shayani @Dayyan_UN
132 Followers 241 Following Data, technology and sustainable development. Statistician at @UNESCAP, previously @UNCTAD. Personal views | #SDGs #Agenda2030 #UnitedNations
Tite Habiyakare @TiteHabiyakare
188 Followers 372 Following Senior Statistician @ILO Asia and the Pacific. Tweets are my own views, and retweets are not always endorsements.
Anton (Anjo) Peez @antonpeez
625 Followers 719 Following Political Scientist/Postdoc, @goetheuni/@PRIF_org・sanctions, global order, research design・alum, @Politics_Oxford/@uniessexgovt/@goetheuni・⚾/🏃♂️

Jon Schleuss supports... @gaufre
10K Followers 10K Following President @newsguild. VP @CWAUnion. Past: @latimes data/graphics/coding journalist. Every worker should build a union. he/him ✊🏳️🌈
Elliot Bentley @elliot_bentley
3K Followers 1K Following Building dataviz tools @datawrapper. Formerly @wsjgraphics & creator @oTranscribe (now part of @MuckRock)
Yasufumi Saito | 斎�... @YasufumiSaito
1K Followers 787 Following Visual data journalist @business in Asia | Data + Code + Story | Previously @WSJGraphics | Views are my own | Mostly English, and sometimes Japanese
Data Cravings @CravingsData
86 Followers 893 Following A collection of awesome Data Visualizations from all over the internet. 📊💕| Me: Larissa Veloso, former journalist exploring the Data World 🗺️| Image: Arif Wa
Jennifer Brandel @JenniferBrandel
12K Followers 10K Following She/they @wearehearken + @WBEZCuriousCity + @Zebras_Unite + #ElectionSOS + #DemocracySOS + @USDemocracyDay + @Civic__Exchange + GoFA https://t.co/enONV8PXx1
Elisa Lindinger @elizab0t
1K Followers 953 Following 🤖 Analogexpertin 💭 Intersectional Tech Policy ✨ Co-founder of SUPERRR Lab @superrrnetwork | she/her | I'm more fun on Mastodon: @[email protected]
Bassam Sebti @Bassam_Sebti
14K Followers 3K Following Digital Marketing Lead Strategist, Founder of @IdeaLabDigMktg | Past: @WorldBank, @WashingtonPost, @ICFJ, @GDIT | Alumnus of @SaintJosephs
Divyanshi Wadhwa @divwadhwa
594 Followers 586 Following Data Scientist @WorldBank Development Data Group | Former RA @cgdev | @Georgetown @DelhiUniversity alumTrends for United States
You might like