Search results for #DataVisualization

Experiment with spider radar chart. Added (URLs) pictures in tooltips. #tableau #dataFam #data @tableaupublic @tableau #datavisualization 🔗 public.tableau.com/views/NobleMet…

SciChart’s charting software is used by 90% of top medical device companies globally. Case studies like this one will tell you why! #medicaldevices #medicaldata #chartlibrary #bigdata #datavisualization #CaseStudy scichart.com/case-studies/r…

Learn how to format axis labels in @visactor/vchart for improved readability and accuracy. Thanks to TingLittleKang for sharing this helpful solution! #DataVisualization #DataViz #CodeTips ift.tt/Lqgnlpw
Learn how to sort data by specified fields in @visactor/vchart! TingLittleKang explains how to configure data sorting based on field types. Check out the code example and related documents for more details. #DataVisualization #JavaScript #CodingTips ift.tt/PQKYdSh

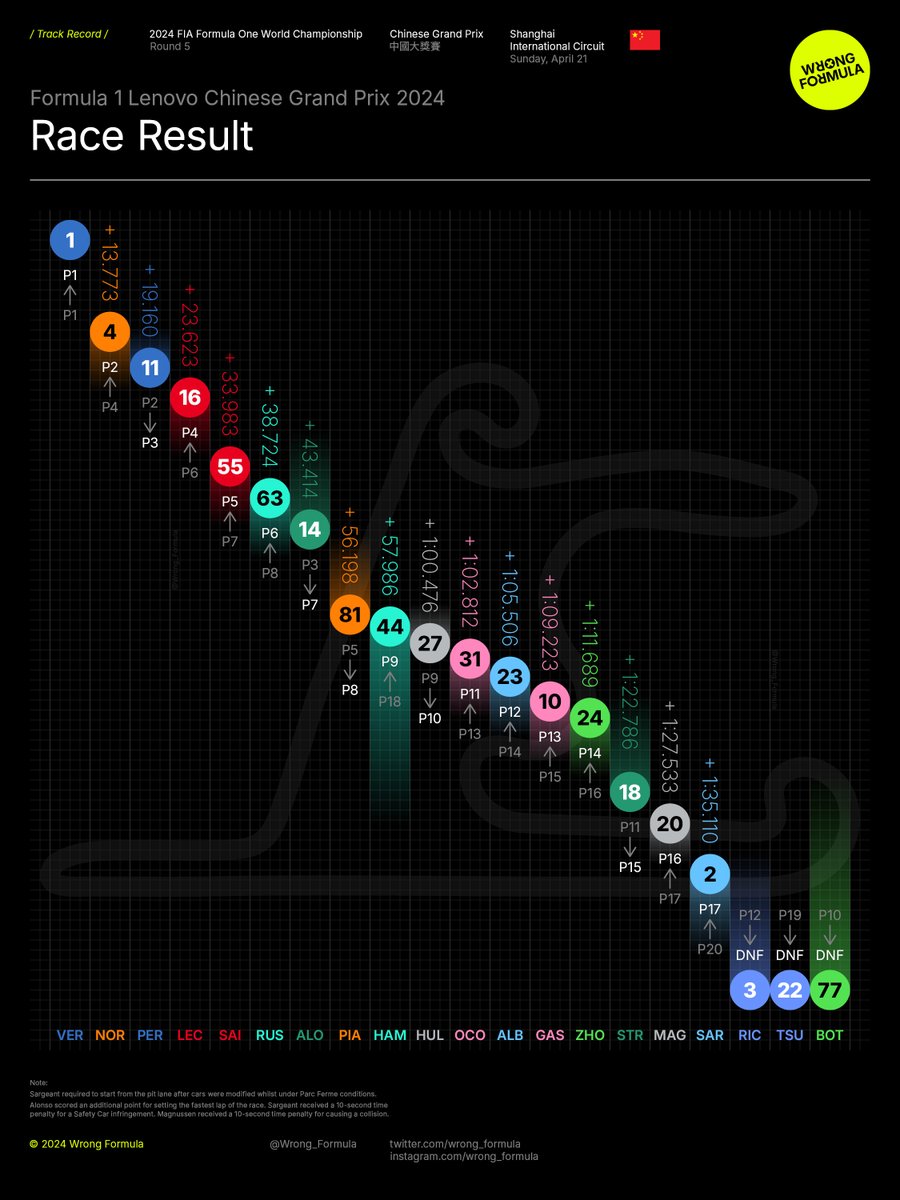
The race result of the 2024 Chinese Grand Prix visualized: #F1 #ChineseGP #formula1 #datavisualization #wrongformula #TrackRecord

(3/3) Read the blog to find the ideal fit for your organization's data needs->bit.ly/3UwMXIX #data #dataanalytics #datavisualization #businessintelligence


For your data analysis, proofreading and language translations (Portuguese to English and vise versa)... Visit or contact Us @ biostatseasy.com #Breaking_News Congratulations Doc #ColumbiaUniversity #Opay Rapture #data #datavisualization #PHD #AcademicTwitter


Struggling to visualize multi-dimensional arrays? 🤔 Think of each dimension👻as a gear⚙️ with specific teeth🦷. The next dimension has more teeth according to its order. For 3 dimensions, 3 gears; for 4 dimensions, 4 gears. Simple and beautiful! #coding #datavisualization 🚀

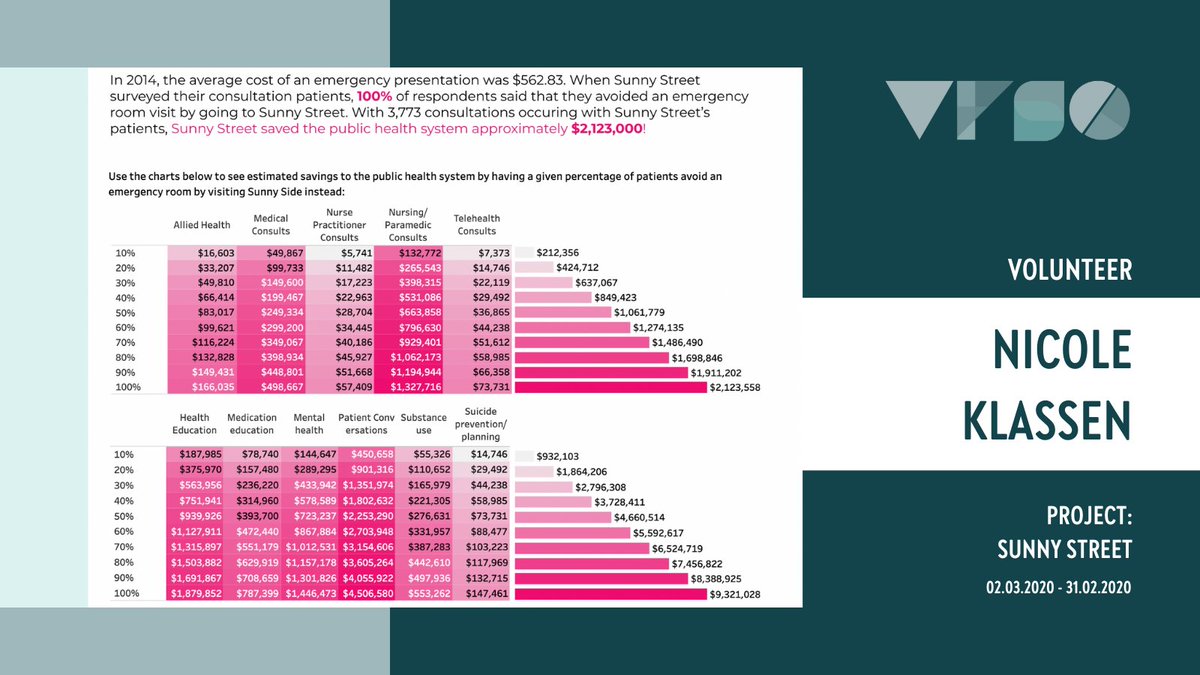
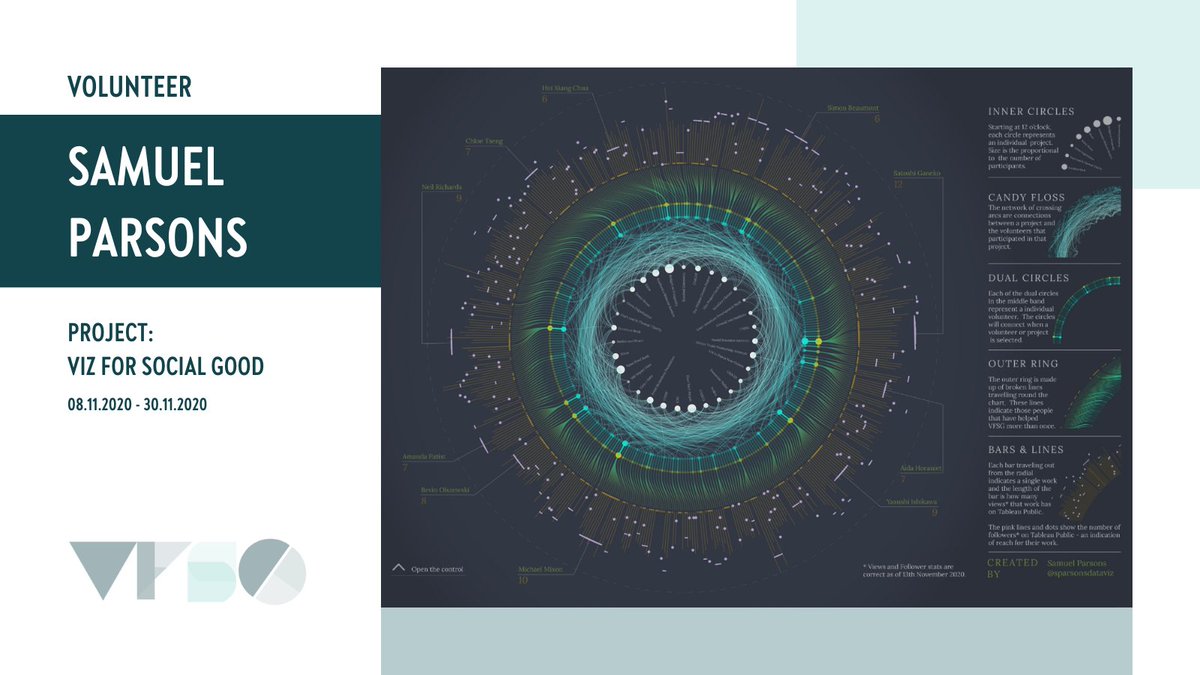
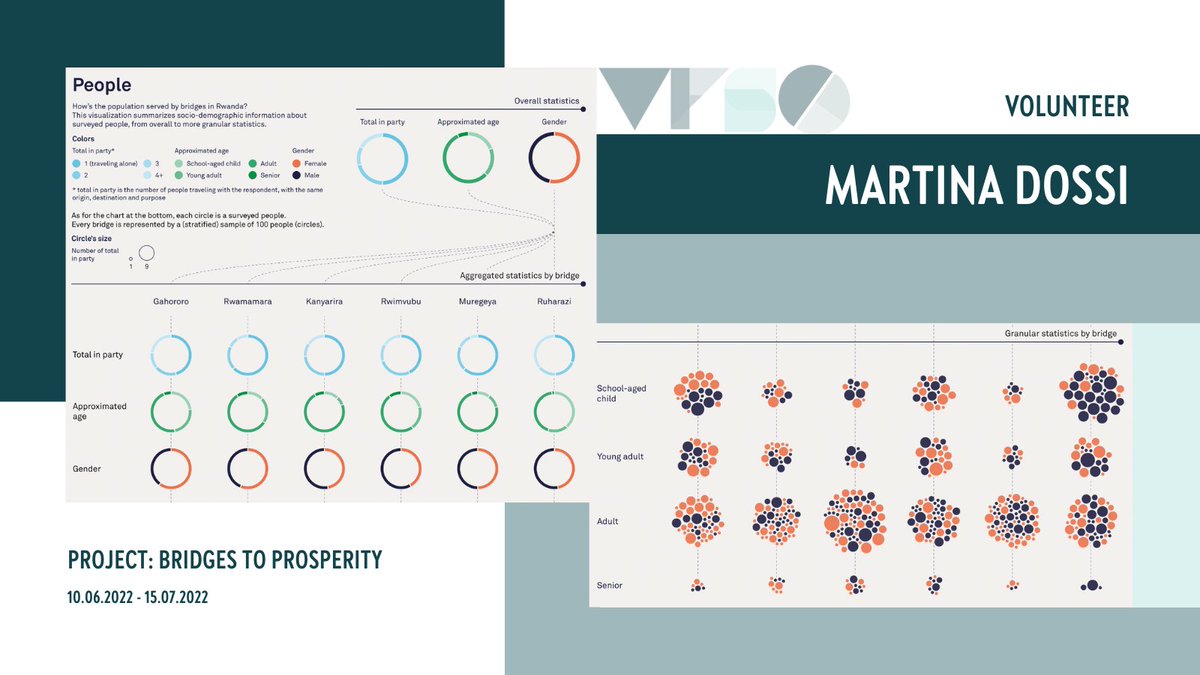
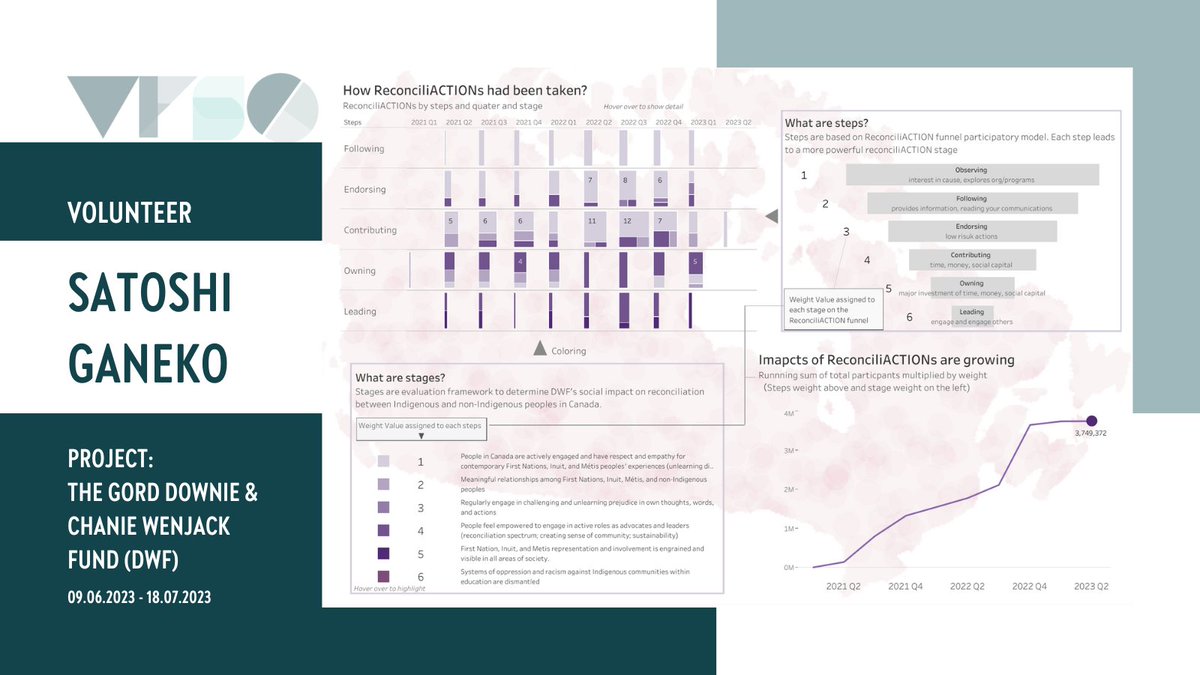
It's #InternationalChartDay 📊, and we're celebrating with some cool charts from #VizForSocialGood projects! #ChartDay #VFSG #DataViz #DataVisualization #DataFam

Learn how to sort one column by another in PowerBI to display data chronologically. Emmanuel Udoh provides step-by-step instructions for this essential task. #PowerBI #DataVisualization #SortingTechniques ift.tt/k9XlFJH

Statistical analysis and data display are essential components of scientific research and decision-making. pyoflife.com/statistical-an… #DataScience #rstats #datascientists #DataAnalytics #r #programming #DataVisualization #statistics #statisticalanalysis


DataVisualization NL @DataVisNL
1K Followers 32 Following Updates on Data-Visualization-related events in the Netherlands. Suggestions for (re)tweets are welcome. (Coordinator: @YuriEngelhardt).
مهندس بيانا.. @Englisheazy
301K Followers 132 Following #DataEngineer #DataInfrastructure #DataDriven #DataWarehouse #DataVisualization #PowerBI #SQL #DAX #python #BusinessIntelligence #ChatGPT
The Data Science Bot @datasciencebot_
2K Followers 1 Following A bot created by @PatkarSumedh to retweet hashtags #DataScience & #DataVisualization Let's learn together! Misusing hashtags and spam will not be tolerated
CryptoVizArt.₿ | Zi.. @CryptoVizArt
40K Followers 281 Following #Bitcoin | #DataVisualization 📊 | #ML 🤖 | Senior Researcher @glassnodeBenjamin Wiederkehr @datavis
13K Followers 549 Following Editor of Datavisualization.ch the premier news and knowledge resource for data visualization and infographics.
Stefan Walther @waltherstefan
2K Followers 218 Following Passion for #AI #ML #CloudNative, #CloudComputing, #BigData, #IoT, #Analytics, #DataVisualization and #Leadership.
datavisualization @datavisual_d
46 Followers 59 Following Twitter account for http://t.co/oKnkxNsfrM
Visual Math @graphnow
2K Followers 0 Following #Math softwares for #calculus, #algebra, #geometry, #statistics, matrix, optimistics, data fitting, probability, #DataVisualization, fractal etc.
Laura Sutter @DotcomLaura
832 Followers 243 Following #Design #OnlineMarketing #AdobeAnalytics #DataAnalytics #DataVisualization #Tableau #datafam #daaorg #socialmediamarketing #tug ...follow @evolytics
Maure Inmobiliaria @maureinmob
5K Followers 544 Following Inmobiliaria Buenos Aires Real Estate. Fuente de información para tus decisiones de inversión #datavisualization #datos #mercadoimobiliario
Carlos Delgado Salas @CDelgadoSalas
1K Followers 354 Following UCAB - Georgetown University - Buscando valor a través de los datos. #DataWrangler #DataScience #DataVisualization #DataMapping
Mariusz Kanicki @MariuszKanicki
2K Followers 311 Following #corporategovernance #corpgov #DPSN2021 | GPW opinie prywatne | #datavisualization |
Pastel GBETOHO @pastelgpc
2K Followers 2K Following Data Architect #Dataintegration #Datamodelling #DataAnalytics #DataVisualization #Datagovernance #DataQuality
Medienneutral @medienneutral
1K Followers 847 Following Über medienneutrale Datenhaltung #Accessibility #Barrierefreiheit #a11y #DataVisualization #OpenAccess
Intersectional Analys.. @ActivistData
765 Followers 168 Following Exploring race, gender, and social justice issues through #datavisualization, #infographics, and personal commentary. Contact: [email protected]
Data Story @datstory
463 Followers 142 Following Creating stories using #datavisualization #dataviz #datstory
Orange Data Mining @OrangeDataMiner
3K Followers 712 Following 🍊We make #DataMining Fruitful and Fun #Opensource software for #machinelearning #ai #textmining #datavisualization #datascience #bigdata Download FREE ⬇️
Thomas Preusse @tpreusse
938 Followers 307 Following Interested in #datavisualization, #journalism and #webdevelopment.
Julien Daubert @judaubert
2K Followers 607 Following CEO at @10h11 - keep building #datavisualization #datamarketing #datascience member of #G20YEA 2017 & 2020 🇪🇺 - $KAS Global Ambassador 🇫🇷🌏
Algorithm Stories @algories
237 Followers 49 Following Creating stories using #ArtificialIntelligence #machinelearning and #datavisualization
infographic.ly @infographicly_
1K Followers 888 Following Information design studio | Dubai & Toronto | Visual storytellers #infographics #datavisualization
datavisualization ID @indonesiadata
11 Followers 8 Following Indonesia Data Visualization is a research & documentation center on Indonesian data visualization, based in Jakarta.
Paul Blickle @colorfuldata
4K Followers 1K Following Datavisualization and Infographics Editor, deparment Data and Visualization at @zeitonline
Nalim Rafeeq @NalimR
2K Followers 2K Following Passion for #Maths #Physics #Research #DataAnalysis #DataVisualization #PatternRecognition #DataStories #Forecasting #Markets & #sports scores

@dataforacause @dataforacause
878 Followers 519 Following #DataForACause is an initiative that connects #datavisualization professionals with non-profits to help bring attention to social and environmental issues.
Andrés Muñoz-J. @SolarDynamo
286 Followers 107 Following Solar Physicist with a passion for #machineLearning, #dataVisualization, and #graphicdesign.
Jian Adornado @JianArt
838 Followers 280 Following Product Design. Data Intelligence. Currently @Motive_inc. Previously @netflix, @dropbox, @uber, @amazon. #datavisualization #ai
Ananda Sagar K @kommaluri
2K Followers 2K Following Social Scientist | Program Manager-Quality @Atos | ❤ #Analytics #BigData #CX #DataVisualization #DesignThinking #EnterpriseAI #IoT #MachineLearning #Robotics
Datavized @datavized
2K Followers 1K Following Data-driven software tools and experiences #sonification #WebXR #3D #datavisualization #dataviz #geometric #twotone #morph
ferdio @ferdiocom
1K Followers 535 Following Infographic agency transforming data and information into captivating visuals. #datavisualization #infographics
Nele_Coghe @Nele_Coghe
1K Followers 971 Following #Analytics and #Datavisualization enthusiast. Product Marketing Manager @HexGeospatial
Pablo H. Paladino @palamago
3K Followers 2K Following Making data nicer all over the internet | @datawheel | #dataVisualization #frontend #openData #openGov #ddj | ❤ #NARDOZ
Ujjawal Singh 🇮�.. @ujjawalsingh
2K Followers 1K Following Creator of successful web and mobile products. TedX speaker/ Angel Investor #bigdata #mobile #datavisualization #tech #politics #india #KREC #NITK #IIML
Orlando Mezquita @orlandomezquita
629 Followers 768 Following Passionate about Analytics... I tweet about: #rstats, #datascience, #msexcel, #PowerBI, #datavisualization...
Daniel Scott Vidovsky @danvidsky
520 Followers 1K Following #BEmusictech startup fandation® 👉 Indie musicians' #datavisualization essays - visual biographies - as a service 👌 Alumn BE incubs @StartitKBC @SirrisICT
Data Visualizatio DP @datavisualiz_dp
1K Followers 2K Following datavisualization, Design, 3D, Map, Processing, Book, Information Is Beautiful,
DesideDatum Data Comp.. @desideDatum
1K Followers 1K Following DesideDatum is a Data Company focused on #DataGovernance, #OpenData, #DataAnalytics, #Transparency, #oGov #Accountability and #DataVisualization
Dimitris Karagiannis @DKaragiannis
787 Followers 2K Following Data Engineer focused on BI #Informatica #SAP Tweets about #BI #DataIntegration #DataGovernance #BigData #Analytics #MDM #Dashboards #DataVisualization #CloudBI
atlo.team @AtloTeam
1K Followers 873 Following Visual and data journalism team of Budapest-based investigative center @Atlatszo #dataviz #datavisualization #graphics #ddj #maps #datajournalism
DataVisualization @DataVisualiza11
2 Followers 0 Following A data Viz aspirant currently working in the Tech field as an analyst. Very curious about the great work being done by peers and experts in this field.
Justin Garrity @justinogarrity
2K Followers 2K Following VP of Product @ChartHop #datastoryteller #datavisualization #peopleanalytics #hr #hrsoftware
Jolicharts @Jolicharts
1K Followers 2K Following #DataAnalytics for your Web Application #DataVisualization, Excel charting and presentations. #SaaS, #dataviz, Simplied #Bigdata for community
Syvylyze Analytics @syvylyze
1K Followers 2K Following Business Insights using Visual Analytics #DataVisualization #DataViz #Analytics using @tableau
Christina Thiele @cs_thiele
1K Followers 2K Following Comms & marketing pro tweeting on #science + #datavisualization + #livablecities + #livablespaces + #sustainablebuilding + #healthyworkplaces + #whateverworks
Tennis Visuals @TennisVisuals
458 Followers 495 Following Tennis Parent, Ecological History, cisgender, #dataviz, #datavis, #DataVisualization, #analytics, #dataanalytics, #d3js #nodejs
Yvonne @YvonFitz
719 Followers 614 Following | traveling scientist, photographer | ❤️ Making Data Actionable | 📉 #DataVis, #DataVisualization, #DataScience, #Data 📈 | Curating Data Viz Society Instagram
Kieran Morris @kieranmorris196
555 Followers 692 Following Tableau Data Visualization Analyst. Manipulating #BigData producing #DataVisualization graphs with Tableau.
Qlik Partner Network @QlikPartners
701 Followers 1K Following @Qlik partners drive business transformation using Qlik’s leading-edge technologies for #DataAnalytics, #DataVisualization, and #DataIntegration.
Timotheos Frey @timfrit
622 Followers 2K Following Citizen •• communication specialist •• political scientist •• loves and creates #datavisualization •• Threema ID: 89R8JWYN
Manish Desai @manishdesai1
874 Followers 2K Following Director @SAS India with focus on #DataScience, #MachineLearning, #InternetofThings, #BigData, #Analytics, #DataVisualization, #DataManagement, #IoT, #Data, #BI
Stela Yordanova @stela_yordanova
867 Followers 871 Following I find data out of sights, one beautiful, bar chart at a time! (she/her) #datavisualization
Manuel George @manuelgeorge
1K Followers 1K Following Visual Editor of #MalayalaManorama @manoramaonline (Newspaper with 2.35 million daily circulation). #Infographics, #DataVisualization, #VisualStoryTelling.
Helen Cooper @HelenOfStow
386 Followers 1K Following Passionate about making a difference using #DataVisualization #Geospatial & #GIS. Founder of Map It Out. she/her
Digital Intervention @paulkaiser
1K Followers 2K Following Inspired by everything around me | Social Media Strategist by day, Futurist by night. #DataAnalyst #DataVisualization #Tech #Influencer #Photographer #Historian
Paul Hodge @DataVizGuy
899 Followers 1K Following Passionate #DataVisualization evangelist, and part-time Global Nomad. Exploring the intersection between #BigData, #Design and #Storytelling (#DataViz)
Yusnelkis @Milanes_guisado
1K Followers 2K Following Research Data Analyst. #Datavisualization #datamanagement #DataSteward #bibliometrics #DatosFAIR #DMPs #datalibrarian #healthcare #systematicreview #consultant
Aránzazu Cruz @arancruzmar
947 Followers 682 Following Computer Engineer and Journalist. Technology projects and products. I like data, #ddj and #datavisualization. Not without coffee. Amateur musician.
DataVisualization @RealDataVisual
4 Followers 0 Following
Oliver Staubli @oliverstaubli
372 Followers 1K Following Founder of @Revolytics AG. #DataScientist providing #AdvancedAnalytics services to clients with #BigData challenges. Loves #DataVisualization & #MachineLearning
Widianto Nugroho @WIDIANTONVGROHO
488 Followers 456 Following Suka menggambar IG https://t.co/NqMBDv270T Past: #creativecoding #processing #datavisualization #infographics
art|code @Thematizer
842 Followers 2K Following #datavisualization made beautiful. Free #SRI and #greeninvesting newsletter at https://t.co/37h247VVIB
Miguel Blázquez @Mblazquez10
704 Followers 1K Following #Marketing / #marketingdeportivo / #bigdata / #bigdatasports / #Publicidad / #datavisualization / #infographic
Giovanni Profeta @profeta_g
379 Followers 770 Following Interested in #datavisualization #interactiondesign #mapdesign
Eugene Tjoa @eugenetjoa
423 Followers 359 Following Designing and creating interactive applications |Datavisualization | Eindhoven
DataVisualization @DataVisualizat3
2 Followers 0 Following
ThomasLe_DataVisualiz.. @LeDa73901
0 Followers 3 Following
Cosimo Firenzani @CosimoFirenzani
185 Followers 1K Following Giornalista. Datavisualization addict. Faccio grafici, infografiche e mappette. Withub