Search results for #ggplot2

#Free #eBook - #ggplot2 Essentials packtpub.com/free-learning


#TidyTuesday 🥘 Variable-sized pie charts in #ggplot2! Each pie shows nutritional breakdown by cuisine, sized by average calories. Techniques: coord_polar() + scales::rescale() + facet_wrap() + {ggflags} Code 🔗 tinyurl.com/t-all-rec Data: @Allrecipes #RStats #DataViz


I'm not really a "coder" :))) Data viz in Python is always tough for me, cuz I never fully get the logic and syntax of such Matplotlib or Seaborn. Then I found #plotnine - a sister of #ggplot2 in R, life just got so much easier! 😊 plotnine.org


We’ll discover how to build clear, elegant and powerful visualisations with ggplot, learning to tell compelling stories through data. transmittingscience.com/courses/statis… #Rstats #DataVisualisation #ggplot2 #ScienceCommunication 📉🎨💡


بهروزرسانی بسته ggplot2 +تغییرات ۴.۰ وبلاگ #TidyVerse خبر از انتشار نسخه جدید بسته #ggplot2 داد و تغییرات زیاد این بهروزرسانی، دلیلی شده تا شماره اصلی این بسته را نیز به روز کنند و به ورژن 4.0 رسید. جزییات بهروزرسانی+کد و نمودارهای مثال در؛ d-learn.ir/ggplot2-4-upda… #rstats


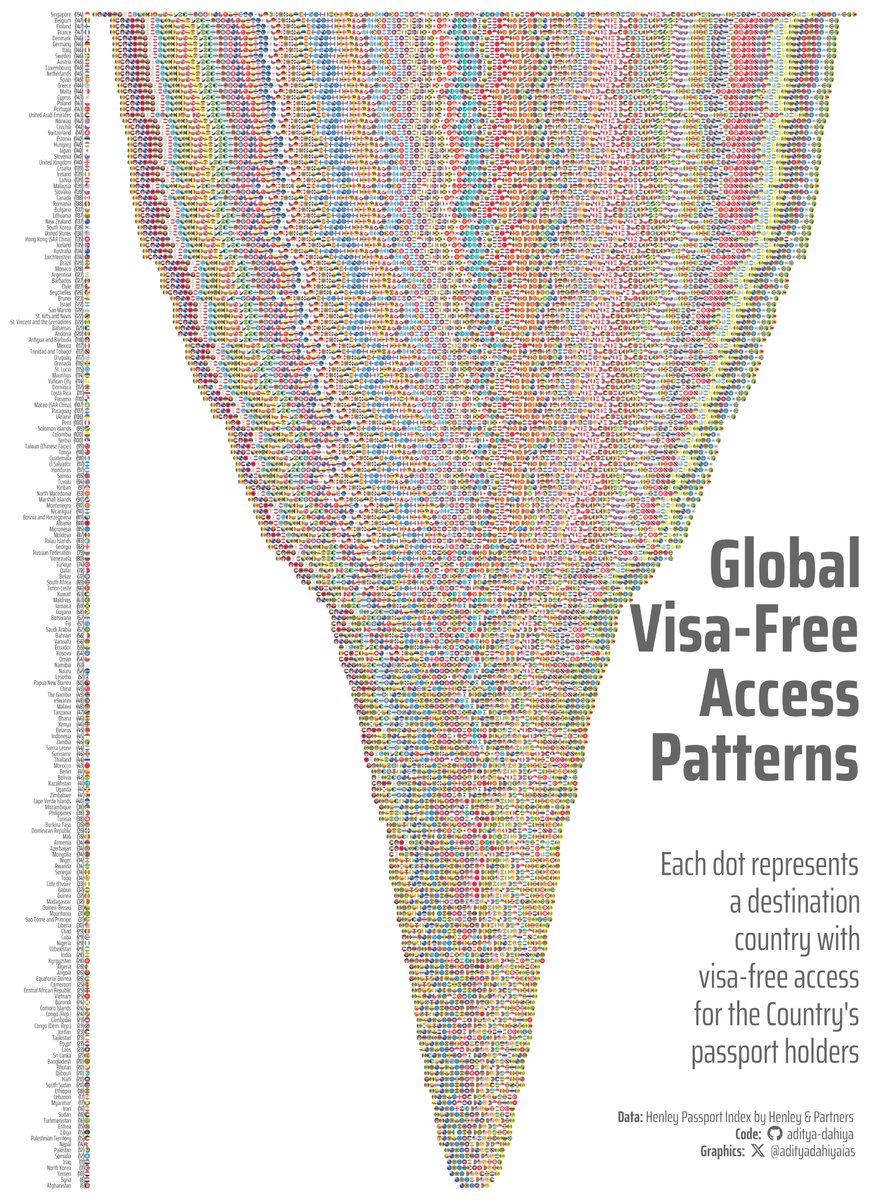
#TidyTuesday Visa-free access visualized with #ggplot2 #ggflags 🚩 to replace text labels. #jsonlite to parse complex API data. Data: @HenleyPartners Full Code 🔗 tinyurl.com/tidy-hpi2 Made with #RStats #DataViz


Peter Cook @peter_r_cook
856 Followers 414 Following Fascinated by tools for visualising data (ggplot2, D3, Tableau etc). Senior visualisation developer at @f_l_o_u_r_i_s_h. Created @d3indepth and @createwithdata.
ggplot2 @ggplot22
13 Followers 0 Following
Ali @rupert_pupkin
5K Followers 264 Following Hazmet kutsal ekmeği ve kurtul! #rstats #ggplot2 #RStudio
Shad Frigui @shadfrigui
2K Followers 301 Following Data Viz Dev. I speak the lingo of the grammar of graphics. #ObservablePlot #ggplot2 #VegaLite #DataViz #BI #PowerBI #supplychain
aRtsy package @aRtsy_package
2K Followers 0 Following I am a twitter bot. Every 24 hours I tweet a randomly generated artwork using #rstats and #ggplot2. Artworks are created using the {aRtsy} 📦 available on CRAN.
American Soccer Analy... @AnalysisEvolved
18K Followers 455 Following Soccer nerds with spreadsheets and ggplot2. Data collection & analysis for soccer made or played in America. #USMNT #USWNT #NWSL #MLS #USL
ggplot2 @ggplot2
117 Followers 14 Following
ggplot2 @ggplot23
3 Followers 1 Following
Maxime Rivest 🧙... @MaximeRivest
4K Followers 786 Following Easy LLM context for all! ✨pip install attachments Inspired by: ggplot2, DSPy, claudette, dplyr, OpenWebUI! Follow for: API design, AI, and Data 🐍CC📜🛠 maker
ggplot2 @ggplot25
10 Followers 147 Following
ggplot2 @libggplot2
2 Followers 3 Following
Aditya Dahiya @AdityaDahiyaIAS
868 Followers 180 Following Reproducible code-based Data Visualizations. R. ggplot2. Views are personal.
Clara | The Data Ink ... @thedatainklab
1K Followers 96 Following This is my account for Data Visualization. Here I post #ggplot2 tips and #rstats #dataviz that I like. Me: @claragranell I have a course on ggplot2! Link 👇
Christian Burkhart @ChBurkhart
4K Followers 414 Following Tidyverse: https://t.co/2hSjyImN4Q Gumroad: https://t.co/ttqhbr1Zrd ggplot2: https://t.co/how6uxin2A
Ansgar Wolsing @_ansgar
2K Followers 1K Following Powerpoint by day, #ggplot2 by night. #rstats #dataviz ░D░A░T░A░V░I░Z░░I░N░░B░I░O░
ggplot2 @Jan_0613_WH
0 Followers 90 Following