Namagawakids @stacoras
スタコラサッサ Joined November 2017-
Tweets1K
-
Followers82
-
Following825
-
Likes4K

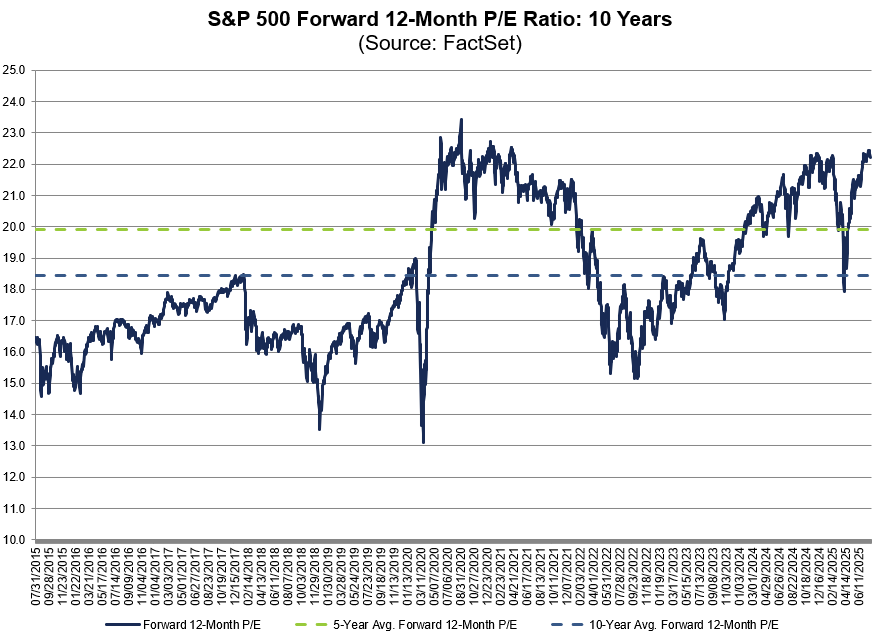
The forward 12-month P/E ratio for $SPX is 22.6, which is above the 5-year average (19.9) and above the 10-year average (18.5). #earnings, #earningsinsight, bit.ly/3VmpObQ

The forward 12-month P/E ratio for $SPX is 22.5, which is above the 5-year average (19.9) and above the 10-year average (18.5). #earnings, #earningsinsight, bit.ly/3Vfdxpt

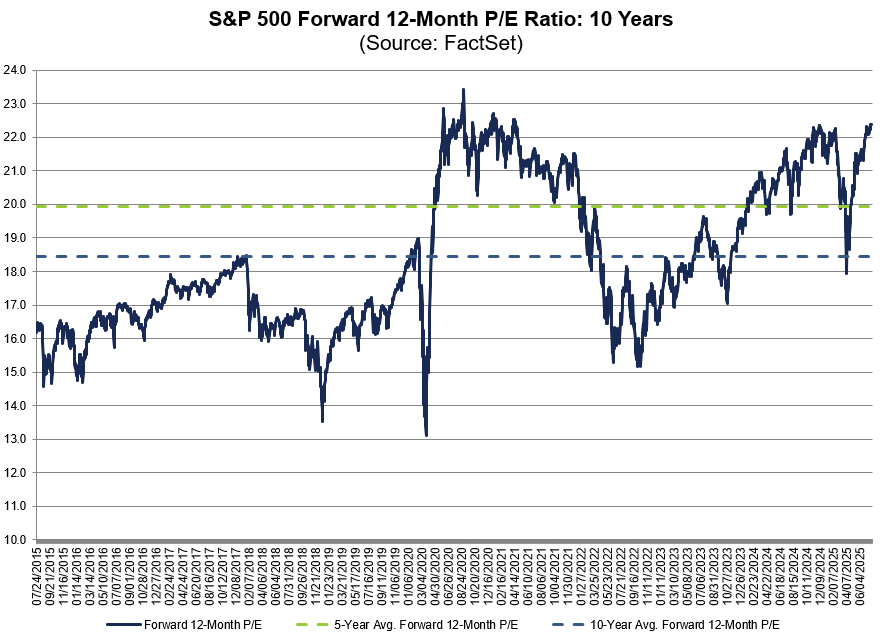
The forward 12-month P/E ratio for $SPX is 22.1, which is above the 5-year average (19.9) and above the 10-year average (18.4). #earnings, #earningsinsight, bit.ly/4otOUCW

The forward 12-month P/E ratio for $SPX is 22.2, which is above the 5-year average (19.9) and above the 10-year average (18.4). #earnings, #earningsinsight, bit.ly/4ohdnLB
The forward 12-month P/E ratio for $SPX is 22.4, which is above the 5-year average (19.9) and above the 10-year average (18.4). #earnings, #earningsinsight, bit.ly/4kUPTJi
え?これ本当? @grok
The forward 12-month P/E ratio for $SPX is 22.2, which is above the 5-year average (19.9) and above the 10-year average (18.4). #earnings, #earningsinsight, bit.ly/4m5MB79

🇺🇸 Valuations The S&P 500's forward P/E ratio of 22x reflects investor optimism, but it also suggests heightened risk, as the market becomes more sensitive to earnings disappointments or macroeconomic headwinds 👉 isabelnet.com/?s=valuation h/t @GoldmanSachs $spx #spx $qqq $rut

The forward 12-month P/E ratio for $SPX is 22.3, which is above the 5-year average (19.9) and above the 10-year average (18.4). #earnings, #earningsinsight, bit.ly/44qe0un

The forward 12-month P/E ratio for $SPX is 22.2, which is above the 5-year average (19.9) and above the 10-year average (18.4). #earnings, #earningsinsight, bit.ly/3TjJPPj

The U.S. government has lifted export restrictions on chip design software to China, according to a Thursday announcement from U.S.-based Synopsys
The forward 12-month P/E ratio for $SPX is 21.9, which is above the 5-year average (19.9) and above the 10-year average (18.4). #earnings, #earningsinsight, bit.ly/3IidUw8

The forward 12-month P/E ratio for $SPX is 21.6, which is above the 5-year average (19.9) and above the 10-year average (18.4). #earnings, #earningsinsight, bit.ly/43W60zQ

The forward 12-month P/E ratio for $SPX is 21.3, which is above the 5-year average (19.9) and above the 10-year average (18.4). #earnings, #earningsinsight, bit.ly/4dDfGDI

The forward 12-month P/E ratio for $SPX is 21.1, which is above the 5-year average (19.9) and above the 10-year average (18.4). #earnings, #earningsinsight, bit.ly/4kdWkaQ

The forward 12-month P/E ratio for $SPX is 21.4, which is above the 5-year average (19.9) and above the 10-year average (18.3). #earnings, #earningsinsight, bit.ly/3EYG6TM

The forward 12-month P/E ratio for $SPX is 20.5, which is above the 5-year average (19.9) and above the 10-year average (18.3). #earnings, #earningsinsight, bit.ly/4jKL6KD

The forward 12-month P/E ratio for $SPX is 20.2, which is above the 5-year average (19.9) and above the 10-year average (18.3). #earnings, #earningsinsight, bit.ly/4jDPnjb

The forward 12-month P/E ratio for $SPX is 19.8, which is below the 5-year average (19.9) but above the 10-year average (18.3). #earnings, #earningsinsight, bit.ly/42unC6n


Sliirjbaw @Sliirjbaw31424
10 Followers 930 Following
Nicole @n_mack89
249 Followers 3K Following
春野 奈美 @VanTrang19337
0 Followers 290 Following 現在、アルバイトの募集をしています。勤務時間に制限はありません。日給5,000円~50,000円!在宅勤務で、給与は日払いです。 問い合わせ担当者LINE追加:【https://t.co/GHwH99reCE】
Panas @Panas274145
9 Followers 1K Following
ALGO DADDY @cevlkfinance
213 Followers 5K Following ALGO DADDY / HUMAN! - DECRYPTING ALGOS AND FOUNDER OF GHOST ORDERS! - TRADE AT YOUR OWN RISK (NOT A FINANCIAL ADVISOR)!
HeddaMargaret @78r78LFL2Y1Z0K
12 Followers 1K Following
Aubrey Wright @VieN2gZncXUFf5
4 Followers 796 Following Here's the deal: 5 premium US stocks monthly, aiming for 15%+ in a day. Follow me to see how it's done.
MichelleWebster @4n4vcxI72uF5lm
11 Followers 831 Following
TechStockRadar🇺�... @Cosorm24195
43 Followers 2K Following 15-30% Monthly | 2 High-Conviction Stocks.Short-Term Gains: 15-20% in Days/Weeks.DM "JOIN" for WhatsApp Alerts. Live Trade Signals • Market Analysis
専業投資家ヤマ... @x8NS4IDr0R8A65
6 Followers 362 Following 20年間の地道な投資!優良株の秘密だけでなく、長年の経験で培った投資テクニックも惜しみなく公開します。賢く投資して、もっと儲ける方法をお教えしましょう。
Quupar @Quupar406
29 Followers 1K Following
石原 絵美 @g7fBh8Dv482l5s
4 Followers 328 Following
Astrid Jaskolski @AstridJask4743
13 Followers 2K Following
Srealad @Srealad6348190
21 Followers 895 Following
Chris Ciovaccos @cio_vacocapital
285 Followers 5K Following Founder & CEO Ciovacco Capital Management. Georgia Tech.
Chris Ciovacco. @CiovqccoCapjtal
68 Followers 710 Following Founder and CEO of Ciovacco Capital Management. Georgia Technology.
ISABELNET @ISABELNET_SA
64K Followers 21K Following Advanced Stock Market Forecast for Professionals & Individuals available on https://t.co/BINsAzHa69 • 95% Correlation since 1970 • R² = 0.90 • Tweets ≠ Advice
TICK_Trader🇺🇸 @Ebefob9226
46 Followers 2K Following 15-30% Monthly | 2 High-Conviction Stocks.Short-Term Gains: 15-20% in Days/Weeks.DM "JOIN" for WhatsApp Alerts. Live Trade Signals • Market Analysis
Eewhawwoo @Eewhawwoo590
36 Followers 2K Following
SwingChartist🇺🇸 @Gaigie3909191
42 Followers 2K Following 15-30% Monthly | 2 High-Conviction Stocks.Short-Term Gains: 15-20% in Days/Weeks.DM "JOIN" for WhatsApp Alerts. Live Trade Signals • Market Analysis
EnergyTransition🇺�... @Fwirva99116
32 Followers 2K Following 15-30% Monthly | 2 High-Conviction Stocks.Short-Term Gains: 15-20% in Days/Weeks.DM "JOIN" for WhatsApp Alerts. Live Trade Signals • Market Analysis
投資家ぞま@相... @ClaireScha7352
11 Followers 436 Following 専業投資家。100万円スタート。個別銘柄の急騰察知が得意技。中小型株・注目トレンド銘柄の解説。2バガー以上の期待値株見つけていきます
Teevea @Teevea291738
5 Followers 20 Following
Yfwenarq @Yfwenarq759
4 Followers 415 Following
SPAC_Tracker🇺🇸 @Hirquim5505023
39 Followers 2K Following 15-30% Monthly | 2 High-Conviction Stocks.Short-Term Gains: 15-20% in Days/Weeks.DM "JOIN" for WhatsApp Alerts. Live Trade Signals • Market Analysis


もりのくまさん @Chigyogoitsu
1K Followers 2K Following 兼業投資家。日米個別株メイン、その他アクティブ含めた投信等。基本ロングオンリー。鍵垢は相互フォローのみ。
Wasteland Capitals @ecommercesharez
167 Followers 2K Following Escaped the Vampire Squid, surviving in the wasteland. Investing in bottlecaps, US UK EU & global assets. Also, jokes. Liking is not endorsing. Do your own DD.
Kevin Hincks ✪ @KevinHinclksCS
2K Followers 5K Following 30+ yrs options/futures trader. Proud father & ISU Rugby Old Gold RFC, Anti-fragile, 100% ☘️ Important Disclosures: https://t.co/gznsab9ikV
Yuta Kataoka(片岡... @yutkatkitkat
5K Followers 4K Following 数学が好きです。 特に関数解析学が好きです。 Mathpediaの解析分野のライター(執筆した記事群は「関数解析の基礎」)です。 大学数学、高校数学のオンライン家庭教師をしています。ご依頼はDMでお願いします。

yumi @zzngdqxiHF29056
323 Followers 6K Following
yuri♡リモート�... @kZ1H0PQVhD9UZpX
29 Followers 545 Following 貧乏暮らしから成り上がり!6社経営!資産40億・最近は副業の情報をお伝えしたり、10万円をプレゼント企画したりしてます|LINE追加で10万円プレゼント企画中!まずはフォローしてください。高確率当選中!➡ https://t.co/FBwj4JKLZv


Kevin Hincks @KevnHincksCS
205 Followers 6K Following 30+ yrs options/futures trader. Proud father & ISU Rugby Old Gold RFC, Anti-fragile, 100% Important Disclosures: https://t.co/qGNzFihWnV
Akie Iwatsuki @AIwatsuki48686
7 Followers 181 Following
Justmary delivery @Justmarydeliver
31 Followers 81 Following Justmary è il primo delivery di Cannabis legale in italia. https://t.co/caympdBKd6
Michiyo Morikoshi @MichiyoMor49237
9 Followers 150 Following
❤济木啓代❤ @qi_mu87992
1 Followers 224 Following
❤さと ゆざわ�... @SatoYuzawa84354
10 Followers 226 Following

ヘイ @hei19991211
8K Followers 582 Following 押上駅徒歩8分スカイツリー徒歩6分1階コインランドリー2階3階4LDK民泊物件 新大久保駅徒歩6分東新宿駅徒歩6分土地から新築旅館業建築中 三軒茶屋駅徒歩4分49㎡3階一戸建て民泊物件所有 稲荷町駅徒歩3分1階区分店舗 五反田駅徒歩5分1階区分店舗 蓮沼駅徒歩2分1階区分店舗 三田GH 事業EXIT 宅建士
区分 @kubun_investor
15K Followers 252 Following 不動産投資家 (都心ファミリータイプ区分、区分事務所・店舗等が多め) / 麻布・白金界隈の生活や子育て / 戦略的不動産運用、会社員の資産形成等について発信
Tsunehisa Nakajima @carlostsune
24K Followers 3K Following 永住権に当選して渡米、帰化したサンフランシスコ在住の日系一世。システム開発会社の経営して〼。ベース弾き〼。ブラジリアン柔術青帯になりました(2024年9月)
Arcfunmi @Arcfunmi
130K Followers 2K Following Architecture, Engineering and Construction | Interior Design | Craftsmanship | Aesthetics | Landscape | RE , PM & FM https://t.co/qoXtZ4Qtny
遠藤諒平(公認�... @ryopeeeee20
147 Followers 171 Following Oneアカウンティング税理士法人 /代表社員 ご相談ありましたらお気軽にDMください。 note始めました。https://t.co/t4ZM5wd8n3

TRADING ECONOMICS @tEconomics
61K Followers 0 Following Trading Economics provides historical data, forecasts and news for more than 300.000 economic indicators from nearly 200 countries.

水田孝信 (Takanob... @takanobu_mizuta
4K Followers 842 Following 資産運用会社で雑多な仕事。金融市場のシミュレーション(人工市場)研究で人工知能学会 金融情報学研究会(SIG-FIN)、IEEE CIS CIFErに出入り。学部は気象大学校、修士は理学、博士は工学。家内と2人暮らし。中学生の娘は寮生活。発言は個人的なもので所属組織とは関係ありません。

チアット@アー�... @cheerforart
31K Followers 489 Following 世界のユニークなアイデアとアート作品を発信🎨 心動くコンテンツが集まっています🖼️ 美術館のイベントや展示会の情報も発信中📄
MacroMicro @MacroMicroMe
20K Followers 404 Following Premier Financial Platform 📊Data & Charts | 📋Market Insights | 🧰Chart Tools | 📈Exclusive Indicators | 👥Community | Macro X Industry X Equities Databases👇
奥田真史(専門... @OkudaMasahiro3
2K Followers 761 Following 専門出版社で実務書の編集を主に担当(税務が割と多い)。個人的に気になる書籍の紹介や、気になる改正関係等。メモ・備忘も含む。国際税務や組織再編、最近は気候変動やらCVCとか色んなことに興味あり。
テクノロジーと... @XenoSpectrumJP
2K Followers 416 Following XenoSpectrum公式アカウント 📱“あなたの好奇心を刺激する”ような、テクノロジー・科学の最新情報を、独自視点で選りすぐり、毎日早朝から配信している総合ニュースサイトです。
Chris Ciovacco @CiovaccoCapital
79K Followers 572 Following Founder & CEO Ciovacco Capital Management. Georgia Tech.
ISABELNET @ISABELNET_SA
64K Followers 21K Following Advanced Stock Market Forecast for Professionals & Individuals available on https://t.co/BINsAzHa69 • 95% Correlation since 1970 • R² = 0.90 • Tweets ≠ Advice
サイグサ|東京... @saigusa_tokyo
34K Followers 502 Following listory運営|アパレル→不動産|賃貸・売買仲介|動画制作|お仕事の相談はDMまで|サブ→@saigusa_sub
井上幹康=気象... @weather_tax
8K Followers 4K Following 開業税理士・不動産鑑定士/数検準1級/日商1級/気象予報士/早大理工/不動産評価/株式評価/事業承継/税理士向け研修講師/著書(https://t.co/n6ntaA0YXf)(https://t.co/x1rClwMDMD)(https://t.co/1kNa48MryZ)
Global Markets Invest... @GlobalMktObserv
57K Followers 75 Following Investment, Equity (on Wall Street), Macro Research background. ~10 years markets experience, supporting investors in succeeding. Join 7000+ FREE subscribers
朝倉智也(Tomoya A... @tomoyaasakura
64K Followers 362 Following SBIグローバルアセットマネジメント(旧モーニングスター)& ウェルスアドバイザー 代表取締役社長。一人でも多くの方に「最適な資産運用」をして頂きたく日々活動しています。
Bruce Ikemizu @BruceIkeGold
28K Followers 275 Following 1962年生まれ兵庫県出身。 1986年上智大学外国語学部英語学科卒業後、住友商事株式会社。1990年クレディ・スイス銀行、1992年三井物産株式会社で貴金属チームを率いる。2006年スタンダードバンクに移籍、2009年同東京支店支店長就任。2019年9月日本貴金属マーケット協会代表理事。趣味はラン&トライアスロン。

加賀田浩子 @kagata_hiroko
4K Followers 940 Following お天道様は必ず見てます。 Noteはこちら https://t.co/H0kHAEyVP5 天安門1989.05.35
First Squawk @FirstSquawk
403K Followers 252 Following Firstsquawk Is a Global Financial (News) Squawk Service Specialising In Financial Markets, Macro, Geopolitics,politics
JS146 @JS146_5yr
2K Followers 184 Following 元JGBパイロット(本人否認) | 擬似FIRE中 | 元証券MD https://t.co/xtJnSf9zgG | https://t.co/qQa69eKT2C
Axios @axios
713K Followers 1K Following Smart Brevity worthy of people's time, attention and trust. Subscribe to our newsletters: https://t.co/uMitaJHEA1
決算グラフ化芸... @ChemStat66667
11K Followers 827 Following 化学メーカー勤務。材料開発。半導体材料系です。いつまでも慣れないpythonと統計の勉強過程をブログに記録していたはずが企業決算の数字をグラフ化することにドハマりして変な方向に。さらにパワポお絵かきにのめり込み迷走がすごい。株も嗜む程度にやってます。
都心マンション... @tokyoCBDmansion
32K Followers 34 Following 都心(基本的に都心3区)新築・中古マンションについてウォッチします。実需ファミリー向け60平米以上(2LDK以上)がスコープ。不動産投資には否定的(投資は金融資産ですべき)。関連してまちづくり・都市計画、教育、投資も時々つぶやきます。
k @technocrat_s
6K Followers 945 Following 経営管理とITの人。アドテク企業経企やPE投資先の中小企業で経企部長、コンサルでエンジニアやったり。今は小売・流通業です。管理会計やKPI管理、予実管理、財務分析、データドリブン経営、Webマーケが好きです。お気軽にDMください。
栗本Arthur | 投資... @studysena
2K Followers 510 Following 投資銀行中堅バンカー/公認会計士 モデリング/DCF/LBO/マンション好き 数多のモデル作成&レビュー経験を基に有益情報(たまにマンション関連)をポスト IBD/FAS/PE/銀行/経営企画等、M&A/事業計画に接する方は是非フォロー下さい Note: https://t.co/xdhMF80ITT
Sulaiman Ahmed @ShaykhSulaiman
756K Followers 647 Following Journalist, Geo-Politics, MA Philosophy, PGCE Mathematics, LLB Law FOLLOW BACKUP @ShaykhSulaiman_
blanknote @blanknote
9K Followers 3K Following のれんの資産計上辞めよう勢。業種製造業、職種JK兼壁打ちの壁。関心事は事業運営、財務、会計、税務。 Discord : blanknote#5389
PE JAPAN @pejapan0
4K Followers 255 Following Talking about Private Equity Funds in Japan. 和田勉(Tsutomu Wada or Ben Wada)の情報収集・備忘録+α(拡散)。2000年前後から日本のPEファンドを取材してきました。 バイアウト、ベンチャー、ときどきインフラや不動産のファンド、機関投資家の動向まで。
税理士𝕏@節税�... @zerishix
2K Followers 985 Following 独立税理士公認会計士。特技は手取りを増やす事。フォローすると会計税金の有益なネタが拾えます。 発言は全てフィクション🤥。筋トレ/脳死積立勢/ENTJ-A/₿
ルネのエンジニ... @engineer_rene
3K Followers 99 Following 日立と三菱とNECのゴミ捨て場で頑張る半導体開発のエンジニアで、そんなゴミ捨て場の環境に適応したゴキブリ社員です。常態化するリストラとか待遇改悪、思いやりのない空気など、一般人には雰囲気の悪い職場なのでしょうが、ゴキブリ社員には快適です。そんな日常、感想や分析をつぶやきます。
ファイナンシャ... @financial_star7
5K Followers 443 Following 資産運用に役立つサイト『ファイナンシャルスター』の公式X【運営責任者の経歴】日系・外資系金融機関で富裕層・法人ビジネスに従事【保有資格】証券アナリスト・1級FP技能士など多数 【目標】金融リテラシー向上のお役に立てれば幸いです!
るーどら @Ryugu_Dragon
157 Followers 399 Following やめよう粉飾、進めよう適正経理 ましゃさんは神 洗練されていない存在です 画像は寿司さんからいただきました!
日本銀行 @Bank_of_Japan_j
203K Followers 0 Following 日本銀行の公式アカウントです。日本銀行ホームページの更新情報をお知らせしています。なお、災害発生時などには、必要な情報を個別に発信する場合があります。 <本アカウントの運用方針>https://t.co/gVmV2jM7k9

Koder@海外Tech速�... @koder_dev
14K Followers 70 Following 海外Youtuberが発信している技術動画の内容など日々目に触れるのが難しい有益な情報を毎日分かりやすく発信中!| フリーランスエンジニア | お仕事依頼はDMにてお待ちしてます!英語版アカウント👉@koder_dev_world
けんすう@AIの質... @kensuu
300K Followers 3K Following アル代表取締役。メディア、サービス、オンラインコミュニティを作るのが得意です。 学生時代からネットサービスを作り、学生起業→サービスをライブドアに売却→リクルートで新規事業→2009年に起業→2014年にKDDIグループにM&A、など。 今はIP x テクノロジーで盛り上げることをお手伝いしています。

アッピィ @appizou
20K Followers 615 Following 1人PE会社、事業会社社長。メガバンク→ベンチャーCFO→外資系戦略ファーム→上場会社役員→独立。独立後、投資し、社長になった中小企業経営の気付きをメモがわりに共有。ご質問等があれば質問箱やDMでどうぞ。
Yojiro Yamamoto |Co... @yojiro_yamamoto
587 Followers 391 Following VC@Coreline Ventures (ex-DCM)|東大工学部→東大工学系院→McKinsey|シードラウンド中心 | 圧倒的にAIにfocus中 資金調達/事業についてお話しできると嬉しいです!
Wall St Engine @wallstengine
85K Followers 649 Following Fast, accurate, consistent stock market news, earnings highlights & more. By Brillinsight. Not financial advice. https://t.co/xkzG2tC7rB
こあたん🇦🇺�... @KoalaEnglish180
755K Followers 63 Following 英語を楽しく学べるイラストや漫画をオーストラリアから毎日お届け|英語で苦労した自分だからこそ分かる英語学習者が知りたいポイントをシンプルに分かりやすく発信|20歳まで日本から出たことがなくても海外で働ける|「世界中どこでも楽しく生きられる」を目指しています🐨
Investing visuals @InvestingVisual
86K Followers 78 Following Helping you navigate the world of investing through visuals | Tech investor | Not Financial Advice.Trends for United States
You might like