
Andy Kirk | Visualising Data @visualisingdata
Independent data visualisation expert: Designer, consultant, trainer, lecturer, author, speaker, host of ‘Explore Explain’ series. *Cross-posting* visualisingdata.com Leeds, UK Joined April 2010-
Tweets46K
-
Followers57K
-
Following1
-
Likes601
Nami is doing some terrific data viz/graphic reporting, if you’re not already following her work it’s a good time to address that

Nami is doing some terrific data viz/graphic reporting, if you’re not already following her work it’s a good time to address that


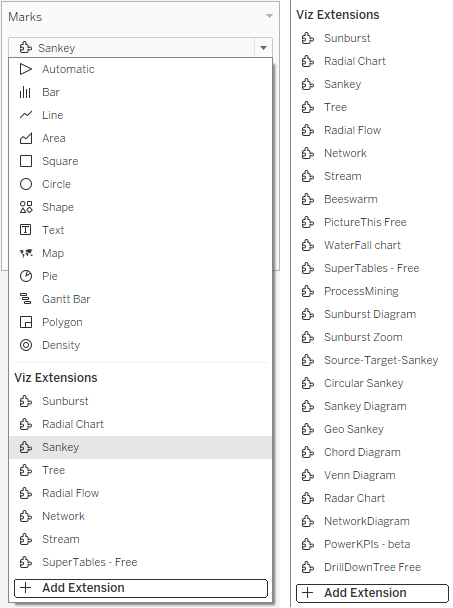
Tableau Viz Extensions, available in the 2024.2 beta, are a real game changer. Video: bit.ly/3Wk6ZYg #tableau #data24 #dataviz
If you're making a short list of the finest map-makers in the business, Lauren's name will be on there in permanent Sharpie. Huge loss to graphic reporting, huge gain for @Esri

If you're making a short list of the finest map-makers in the business, Lauren's name will be on there in permanent Sharpie. Huge loss to graphic reporting, huge gain for @Esri

Final mention for this brand new episode about the values that motivate and guide a dataviz studio, @beyond_wrds. 📺youtube.com/watch?v=oBAWGF… 🔗visualisingdata.com/2024/04/explor…
Final mention for this brand new episode about the values that motivate and guide a dataviz studio, @beyond_wrds. 📺youtube.com/watch?v=oBAWGF… 🔗visualisingdata.com/2024/04/explor…
If you run a data viz studio, work in one, want to work with one, want to start one, or work with studios as partners, this will be an enlightening 60 mins of your time with the brilliant Rebecca and Duncan of @beyond_wrds
If you run a data viz studio, work in one, want to work with one, want to start one, or work with studios as partners, this will be an enlightening 60 mins of your time with the brilliant Rebecca and Duncan of @beyond_wrds
NEW EPISODE: Season 5 Episode 1 of 'Explore Explain', a 📺 🎧 series of long-form data visualisation conversations. In this season opener I chat with Rebecca & Duncan from @beyond_wrds about the importance of a studio culture shaped by strong values. visualisingdata.com/2024/04/explor…

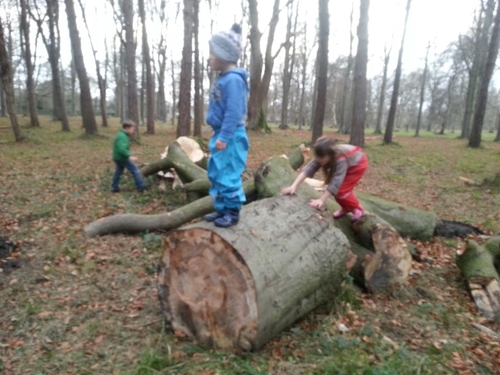
10pm: “So tired, going to bed” 3am and 356 Wikipedia pages later: “Ah so that's why there are holes in Swiss cheese…”
Thrilled to share news I'm working with the wonderful Anne-Marie Dufour to translate my 'Seinfeld Chronicles' dataviz from its original limited-edition print form into a digital solution for all to experience. Hitting browsers later in the year! visualisingdata.com/work/#Seinfeld

1️⃣ "The Visual Design of Data" w/ @visualisingdata & @stefpos on May 14, 16, 21 & 24. 🎟️twtr.to/6lZct 2️⃣ "Masterclass: Visual Storytelling with Data" join me on July 1,2, 3 to master the art of transforming raw data into compelling visuals 🎟️twtr.to/lXcLs
Hi #datafam, or anyone looking for a practical online training to level-up their dataviz skills, I have two events coming up. Beginners or pros, these sessions are designed to enhance your ability to craft compelling visual stories from data. ✨ #DataViz #VisualStorytelling

Rare opportunity to work on the Washington Post's graphics team from (some places) in Europe! We are looking for a graphics reporter who works well independently, feels comfortable covering news and is a good collaborator. Any questions, please DM! washpost.wd5.myworkdayjobs.com/washingtonpost…
This is heading to subscriber inboxes in 24 hours. visualisingdata.com/newsletter/

Issue #3 of the 'Visualising Data' Newsletter will be hitting inboxes next Tuesday, showcasing 50 of the best things I've come across over the last month. To get a flavour, have a browse through the first two issues, then get subscribed! visualisingdata.com/newsletter/


New #dataviz training course scheduled! 👨🏼🏫'Masterclass in Data Visualisation' 🏫Classroom-based, central London 🗓️ 10-11 July, 9:30am-5pm each day 💳Early bird rates until 10 May 💷2 places available on ‘pay what you can afford’ basis visualisingdata.com/2024/04/new-co…
Later this afternoon I have the pleasure of recording season 5 episode 3 with Natalie Erdem from @2nfo to learn about their work developing the @MSNBC election maps. It’s the first episode covering the unique nature of TV-viz.

From last year, I logged each key moment of activity during a full day of work to give an insight into a sample, typical day as a data viz freelancer. Think I’ll repeat this at some point, with less granularity, but for a whole working week. visualisingdata.com/2023/07/a-day-…

If you are in DC, the cultural office of the Embassy Spain will be hosting SPAINFOGRAPHICS, an exhibit on the work of spanish graphics journalists in US. The exhibition opens April 17 and I'm looking forward to celebrate the work of colleagues and friends spainculture.us/city/washingto…
My team at the @sfchronicle is hiring a data visualization editor! Reach out if you are interested / have questions! eevd.fa.us6.oraclecloud.com/hcmUI/Candidat…

Alberto Cairo @AlbertoCairo
68K Followers 5K Following For news, follow me on BLUESKY: https://t.co/nN8zwUEmZs and LINKEDIN: https://t.co/BV7fInzN6w
Nadieh Bremer @NadiehBremer
48K Followers 579 Following Data Visualization Artist (+ graduated Astronomer ✨) with a love for Data & Generative Art | 🇳🇱 https://t.co/2QeuXCOGlo
Federica Fragapane @fedfragapane
20K Followers 1K Following Information designer based in Italy. Works in the Permanent Collection of MoMA 🔗 https://t.co/ggpM8XORDO
Tableau #Data24 @tableau
178K Followers 3K Following Tableau helps people see and understand data. We 💙 our #DataFam. Tableau Conference April 29-May 1 #Data24
Kevin Flerlage @FlerlageKev
17K Followers 3K Following Tableau Evangelist/Data Visualization Consultant at Moxy Analytics | 5X Tableau Visionary | 5X Tableau Public Ambassador | One Half of the Flerlage Twins
Jon Schwabish @jschwabish
24K Followers 996 Following 📈Economist & DataViz 🕸@urbaninstitute @PolicyViz 🎙PolicyViz Podcast 📺YouTube step-by-step tutorials 🗞On Substack: https://jschwabish.subst 👀All views mine
Data Visualization So.. @DataVizSociety
81K Followers 353 Following We are dedicated to fostering community for data visualization professionals. 📧 https://t.co/vImqO00uDF
JasonForrest @Jasonforrestftw
7K Followers 970 Following https://t.co/tUp3q8hcyI Ex-McKinsey Data Visualization Lab, Editor-in-chief of Nightingale, Electronic Musician. https://t.co/6OqWYBRFs0
ZACH @ZachBowders
8K Followers 659 Following Data + Love Podcast | Tableau Visionary & Ambassador | Dataviz Maverick
Sarah Bartlett @sarahlovesdata
16K Followers 4K Following 5 x Tableau Visionary | 6 x Tableau Ambassador | #LondonTUG | Founder of #IronQuest, based on #IronViz | #datafam | #data24 | https://t.co/ATPjQrYScf
Andy Kriebel @VizWizBI
34K Followers 2K Following Global Head Coach @ The Data School | Tableau Visionary HOF | Training the next generation of great data analysts. Tweets & threads to help you be great too.
Cole Knaflic @storywithdata
35K Followers 775 Following Helping people create graphs that make sense, present powerfully. CEO & author of #daphnedrawsdata, #storytellingwithyou, #SWDbook & #SWDletspractice!
Alli Torban @AlliTorban
9K Followers 988 Following 📕 Author of Chart Spark 📊⚡Information Designer and Senior Data Literacy Advocate 🎙 host Data Viz Today podcast
Neil Richards @theneilrichards
8K Followers 1K Following Tableau Visionary Hall of Fame & Public Ambassador | Global Data Fluency @JLL | https://t.co/q1nvEnM4QD | Questions in Dataviz book released Nov 2022
Tristan Guillevin @ladataviz
6K Followers 485 Following 1/2 of https://t.co/bhhqfCdjl5 ▵ Export your @figma desing to @tableau in one click: https://t.co/iNmH38rLhI 💌 Weekly news: https://t.co/fFtiLoGo49
Lisa Charlotte Muth @lisacmuth
35K Followers 729 Following Formerly @lisacrost. Creating & writing about dataviz for @datawrapper. #visber & @datavisclub organizer. Also over there: @[email protected]
Pradeep Kumar G @pradeep_zen
6K Followers 896 Following 4x Tableau Public Ambassador / #IronViz'21 Finalist / 2x Vizzie Awards / 12x #VizOfTheDay / #IIBAwards'22 Bronze / 2nd Most Favorited Author on @TableauPublic
Evelina Judeikytė @parabolestudio
4K Followers 1K Following Data storytelling for mission-driven orgs 🎯 Founder of Parabole Studio 📡 Learn data storytelling with me 👉 https://t.co/fVmB5ujjCI
Yan Holtz @R_Graph_Gallery
19K Followers 724 Following Software engineer who ❤️ #dataviz. Creator of https://t.co/sj29jZPkYr and the R, Python, D3 and React graph galleries. ➡️ https://t.co/PoJNeHXz8a 📈 🌊 🍺
Lindsay Betzendahl @ZenDollData
11K Followers 2K Following 5x #TableauVisionary, 5x @tableau Public Ambassador | 11x VOTD | @vizhealth, views are mine | Creatively #ADHD | #projecthealthviz #momswhoviz #datafam #data24
Alexandra Ispas @petree3n
0 Followers 42 Following
Engineer O. @ominets
1K Followers 2K Following Data Science, A.I (ML), Engineering, ICT, DBA and Cloud specialist. Wannabe entrepreneur & Python Programmer
klaus leung @klaus2093
1 Followers 35 Following


Pilla Harvey @chinchillesca
513 Followers 505 Following She's the kind of girl you read about in new wave magazines

LuckyCat99 @LuckyCat99btc
234 Followers 2K Following Digital Artist & Curator. Art is like an urge that can't be suppressed, it's like breathing air. You need it to survive; without art, you are dead not alive.
Bhavitha Chowdary @BhavithaChowd12
13 Followers 96 Following

Yuya Kawakami @Yuya__Kawakami
4 Followers 251 Following
Tod Thiele @todthiele
4K Followers 3K Following Assistant Professor, University of Toronto Scarborough, Neurobiology
بوكسات Booxat @Booxatapp
452 Followers 1K Following بوكسات هو تطبيق تأسيس شركة ارنوب لبيع الالعاب أول شركة وتطبيق عربي يتخذ مجال بوكسات الألعاب مختصاً. عروض مبتكرة ومميزة للأطفال ، تجربة ممتعة للعملاء.


Andrew Middleton @EcoAndrewTRC
2K Followers 2K Following CEO of The Map Center, Pawtucket RI 'Diving Monterey' atlas https://t.co/7Y1fU2pq6m Still getting my Mastodon legs but @[email protected]
🇿🇦Mlunghisi Kho.. @Lungstar_K
7K Followers 6K Following @go2uj @Golden_Key @NRF_News @YALI_SAfrica @SAYoF_SADC @BRICSSouth @TheSoE_ @yaldafrica @SABPP1 @Action4SA
Veda Prakash @prakashchinta_v
7 Followers 132 Following
Ray @Ray083726166434
3 Followers 22 Following
Joanne Byrne @jolisby
213 Followers 111 Following
Laleh Jalilian MD @DrLalehJ
333 Followers 2K Following Adult Intensivist/Anesthesiologist | Clinical Associate Professor @UCLAAnes | @UCBerkeley alum. AI/ML and data science to improve healthcare quality and safety.
Ahmed Shiha @ahmedshihaa
298 Followers 3K Following
inscribe318 @inscribe3167971
5 Followers 10 Following

Jason Revis @jason_revi75756
0 Followers 8 Following

BAHRAM @BAHRAM517345
105 Followers 2K Following

Stephen Nwaozor @Prof_excellent9
63 Followers 184 Following Need to satisfy your self with Ebooks click on this link below 👇
Sembatya Moses @mnsembatya2
34 Followers 90 Following Husband |Father|Son|Statistician|Monitoring & Evaluation|Data Storyteller|Student of Leadership
Eleanore Parker @ElearePa
4 Followers 23 Following I love to do ногти💅🏻 I get a high out of every day


Toivo Pärnpuu @toivopuu
29 Followers 351 Following
whereareweat @whereareweat_xx
96 Followers 464 Following
AlurGuy @Mannfelixx
171 Followers 140 Following GIS Analyst & M&E Expert| Passionate Farmer |Learning photography | Proud Alur from Nebbi @IamApass diehard
Golf_Charlie @CharleeGolf
0 Followers 432 Following
jhag @jhag386231
15 Followers 95 Following
Cephas Kagaba @SCKagaba
3K Followers 5K Following Studied Economics & Statistics,, I know 1 or 2 things about M&E. #VisitKisoro. Check out my Resume on LinkendIn

Panctual @andrew_ashaba
133 Followers 373 Following

Gloria Ninsiima @Gloriz646
261 Followers 312 Following Geospatial Expert. Monitoring and Evaluation Associate. Information Technology proffessional. Leader. Daughter. Genius is 99% inspirational and 1% perspiration.
Charles Abura @90Abura
102 Followers 1K Following
Ojok Ronald Steward @Wodparwech
271 Followers 701 Following Family Man, Versatile Monitoring, Evaluation, and Learning Specialist, Proficient in Data Analytics, Program Evaluation, CQI , Strategic Thinker!

Explore Explain | A V.. @Explore_Explain
3K Followers 1 Following Andy Kirk’s 📺+🎧 long-form conversations with data visualisers to explore their design process and explain the hidden stories behind their brilliant work
@visualisingdata Thanks Andy - both newsletters have been excellent. Really insightful ideas and concepts being shared. At a time when pretty much everyone has a weekly/monthly newsletter yours is one of the very best and one I will keep to refer back to! 🤓👍 📊

earth.nullschool.net was launched 10 years ago today! 🎉 At the time, I couldn’t have imagined the longevity and impact this project would have. To all the users and fans over the years: thank you. And with this anniversary, an announcement:


earth.nullschool.net: an animated map of global wind conditions
This is a great book, so this is great news
NEW POST: Starting work on the 3rd edition of my book & discount offer for my upcoming training courses visualisingdata.com/2023/11/work-s…

Super happy to announce this two day dataviz training with Andy Kirk (@visualisingdata). Come and join us in Utrecht. December 12 & 13 graphichunters.nl/graphical-lite… #dataviz #DataVisualization

Emma Hayes: “I always say to players we see the game horizontally, they see it vertically”


Dear Liverpool FC, presented by @NIVEAMENUK… @TrentAA surprises a lifelong Red, Imad Ali, who is helping bring the world together in the heart of our city through his @WorldInOneCity1 tournament 🌎 One very special community ❤ #ad

@theboysmithy @EdwardTufte (4/9) @visualisingdata does a brilliant job of outlining lots of different chart types and what they are used for. This book also includes great examples that help readers decide which visualizations would work best for their data type and audience.

Brilliant morning getting to grips w/ #datavis essentials with @visualisingdata at @UoNScience. Amongst others w/ students and post-docs from @notts_psych @SPMIC_UoN and @UoNMaths


#Data visualisation workshop with @visualisingdata, super useful for anyone wanting to effectively communicate virtually anything for any purpose, both #research & #business. Plenty of meaningful discussion during the break time, too. All courtesy of @schluppeck at @notts_psych


Covid-19 global health emergency is over, more than three years after being declared, World Health Organization says bbc.in/423FmTs

Great conversation about Nightingale magazine at #outlier2023, hosted by @visualisingdata with @Jasonforrestftw Emilie and Julie.
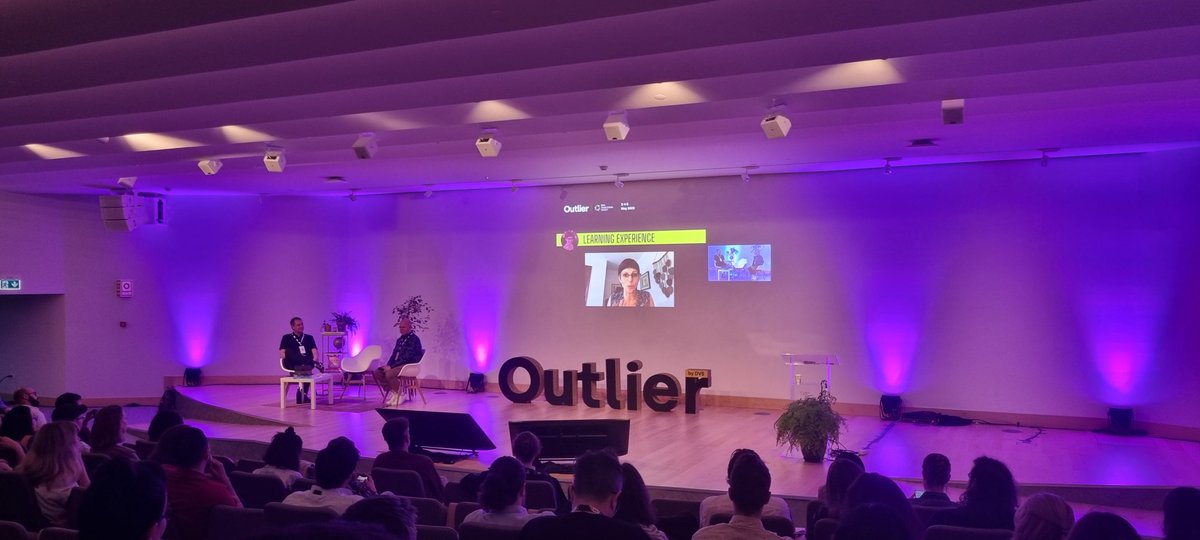
It’s @Explore_Explain live at #outlier2023 with @visualisingdata and @Jasonforrestftw (and the rest of the team joining virtually). Looking forward to learning all the behind the scenes tricks and secrets!


.@visualisingdata & @Jasonforrestftw take the stage to talk about the making of Nightingale Magazine, the journal of the @DataVizSociety. Print Issue 3 drops this month! #outlier2023


#outlier2023 The Nightingale story and the vision behind this cool magazine @Jasonforrestftw @visualisingdata


Almost didn’t make it back in time, but we did! Was so excited for this session by @visualisingdata and the Nightingale team! 📕 @Jasonforrestftw @datacitron @ClaireESantoro and Emily Barone

This #outlier2023 session is making me so excited to sit down w/ Nightingale (after I graduate lol) thank you @visualisingdata for organizing I was so excited for it & thank you Emily Barone @ClaireESantoro @datacitron @Jasonforrestftw for this beautiful magazine I’m such a fan💖


One of the absolute best parts of being at an in person conference is getting to finally meet folks in person who have been huge @DataVizSociety supporters & leaders in our field. You'll find @visualisingdata on stage with the Nightingale crew this afternoon! #outlier2023


A guard of honour for the man of the moment 💙 🌟 Erling Haaland 🌟
Trends for United States
You might like