Search results for #Dataviz

🆕#ResearchMethods webinar recording! tiny.cc/ResearchArtifa… How can we correct bias from artifacts such measurement error & selection effects in meta-analysis? #MetaAnalysis #ResearchBias #RStats #DataViz @VilgotHuhn @micahgallen


The #30DayChartChallenge may be over for some but I'm still on day 14 - heatmap. Using the {bagyo} package, I've visualised the speed of Philippine Tropical Cyclones over time. #Rstats #Dataviz #GGplot2


ComponentOne's FlexChart for ASP .NET Core & ASP .NET Core MVC boasts 80+ chart types & configurations for visualizing data in .NET web apps. Watch this video to learn how to bind data, add labels, & more using FlexChart: bit.ly/4b0lUeP #aspdotnet #dataviz #charts


#Day30 of the #30DayChartChallenge, #ThemeDay #FiveThirtyEight; the last day 🥹 🇺🇸🫏🐘 2024 Presidential Election Polls 🫏🐘🇺🇸 📂: t.ly/BZh20 #rstats #ggplot2 #dataviz #USA #presidentialelection #Trump #Binden #Kennedy #West


We're THRILLED to announce our @DataConnectConf #dataviz Competition finalists! ✨ Buzz for Change: Bee the Difference! ✨ The Happymap! ✨ An ADHD'rs Journey to Lover Her Neurodivergence ✨ Chiari Malformation ✨ The Love Legacy bit.ly/4a3Y0xE

We're THRILLED to announce our @DataConnectConf #dataviz Competition finalists! ✨ Buzz for Change: Bee the Difference! ✨ The Happymap! ✨ An ADHD'rs Journey to Lover Her Neurodivergence ✨ Chiari Malformation ✨ The Love Legacy bit.ly/4a3Y0xE


#30DayChartChallenge | Day 29: Black'n'White (and Day 27: Good/Bad) Mentions of "angel" 👼 and "devil" 👹 across seasons 1-25 of "The Simpsons". I'd love to display the season numbers along the x-axis instead of a color encoding but couldn't make it work. #dataviz #datawrapper


✅ @Robotics_Summit 📅 May 1-2 📍 Booth #436 💻 Demos, discussions about #DataViz for robotics, answers to all your questions! 📣 Foxglove CEO @adrianmacneil on the lack of widespread #AI adoption in #robotics. 🎟️ Swag, LEGO raffle, fun & more! 🔗 bit.ly/3K00CAU


For #30DayChartChallenge day 29 black'n'white prompt, two charts to highlight the killing of journalists between October 2023 and March 2024 as documented by the Committee to Protect Journalists. #dataviz #ceasefireNOW


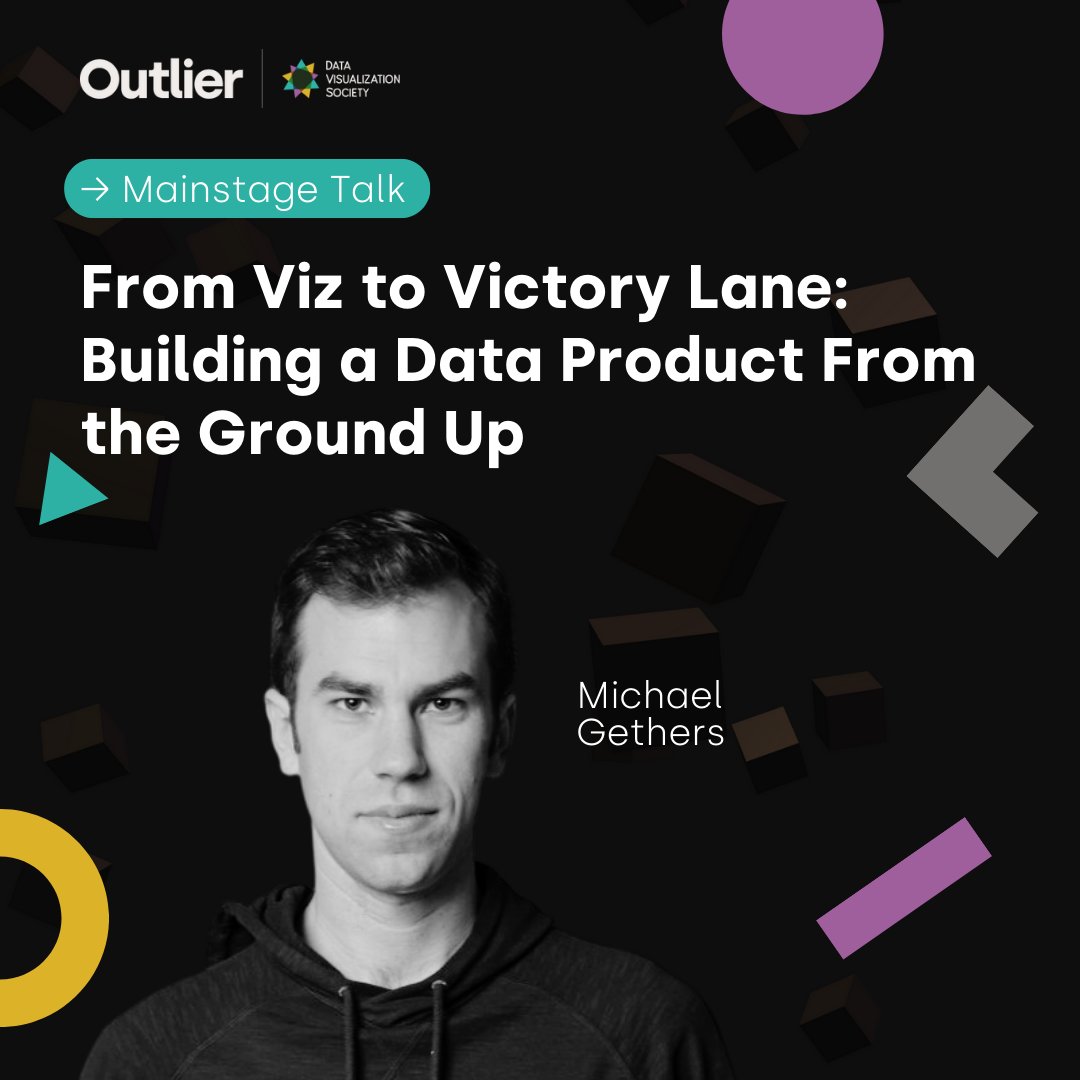
Meet our speaker: Michael Gethers, @michael_gethers with a talk about Business Intelligence and Analytics "From Viz to Victory Lane: Building a Data Product From the Ground Up” Learn more: outlierconf.com #outlier2024 #dataviz #datavisualization

#30DayChartChallenge | Day 25-26 | Global Change + AI Exploring the evolution of scholarly AI contributions: Annual trends in publications including journal articles, conference papers, repositories, books, and theses. #AI #Change #DataVisualization #DataViz


Submit artworks, pictorials and papers to the IEEE VIS’24 Arts Program. The deadline is June 2. visap.net/2024/ @ieeevis @visapnet #Datavisualization #dataviz #digitalart #dataart

#statstab #82 p-value or consonance function using the {parameters} pkg Thoughts: Compatible with many models. Used it with a clm() one just out of curiosity and it worked flawlessly! Not sure if it does one-tailed p-values. #pvalues #dataviz easystats.github.io/parameters/ref…


50% of the Indian population is under 28, yet the current Lok Sabha lacks representation of the younger population and shows a significant gender gap Sources: @IPUparliament and @ppyramidnet #ddj #elections #dataviz


Ross @dataviz
340 Followers 462 Following Question everything know nothing. If your looking for the company their twitter is @datavizinc.
Dataviz Catalogue @dataviz_catalog
7K Followers 669 Following The Data Visualisation Catalogue: A library of information visualisation methods.
Market Cafe Mag - Dat.. @marketcafemag
3K Followers 549 Following ISSUE 8 OUT NOW | World's first printed mag about #dataviz - est. 2016 |🏅Gold winner @infobeautyaward | Founded by @Altiziana & @pierozagami
Data Science Central @Datasciencectrl
195K Followers 3 Following Part of the DSC Community and TechTarget, our focus is on data science, ML, AI, deep learning, dataviz, Hadoop, IoT and BI.
Chimdi Nwosu @DatavizChimdi
5K Followers 2K Following Dataviz Doer | Tableau Visionary and Ambassador | 11 × #VOTD | 6 x #Vizzies | https://t.co/H59ouL3fFW | #MakeoverMonday | #TUGs | @DuboisChallenge @AnalyticsTUG
Chen Szu Yu @dataviz_szuyu
1K Followers 602 Following 臺灣人. graphics reporter @PostGraphics Previously @datagraphics @BBGVisual @BarabasiLab, @NU_CAMD. Tip me [email protected]
DataViz NYC @DataVizNYC
757 Followers 0 Following A meetup organized around data visualization, exploring concepts and technology; and the best data visualization networking in New York City.
David Borczuk @datavizDB
2K Followers 1K Following Former Tableau Public Ambassador | Tableau Featured Author | #VOTD x 7 | Data Visualization Designer | Freelancer | All views are my own

Yoshitaka Arakawa (Yo.. @yoshi_dataviz
873 Followers 169 Following JP Account: @yoshi_datavizjp Blog: https://t.co/cZhbQla5Ax Tableau Public: https://t.co/6zy28FHF62 Linkedin: https://t.co/FxDjyVtlwa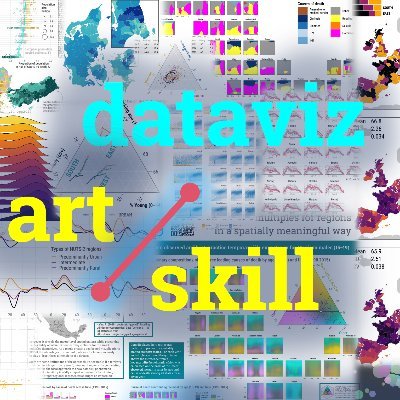
Dataviz Art/Skill @DatavizArtSkill
278 Followers 16 Following Data Visualization – the Art/Skill Cocktail by @ikashnitsky #datavizartskill
Data Viz Camp @dataviz_camp
623 Followers 53 Following A community-run open source conference focused on Data Visualization technologies on Sun Nov. 19, 2017 at Convene as part of @OpenCamps
Let’s talk dataviz @DatavizCrit
450 Followers 81 Following Upcoming book from @lilachmanheim; Let's talk about dataviz: How to improve dashboards, reports, and other data presentations...one conversation at a time
Dataviz Adventure @DatavizAdventuR
822 Followers 830 Following 🇵🇪Enrique Mendoza | Data Visualization & Information Designer | Presentation designer | Infographic designer. I'm on my own adventure in the #dataviz world.

Toulouse-DataViz @Tls_dataviz
561 Followers 44 Following
Bristol DataViz Group @BristolDataViz
94 Followers 34 Following This is a group for individuals interested in data visualisation, where members can skill-share, discuss data visualisation topics and highlight great examples.
Questions in Dataviz @questionsinDV
426 Followers 141 Following New book for 2022 from @theneilrichards - Questions in Dataviz, based on the https://t.co/sOlvzvZDlQ blog. Stay tuned for updates!
Wisevis, dataviz for .. @wisevis
5K Followers 2K Following Hi, I'm Jorge Camoes, #dataviz consultant & trainer (Excel, PowerBI, Tableau). My book: https://t.co/x5nJ2y2qUM. The other one: https://t.co/23Z4SqzTzz
Superb DataViz @prettydataviz
139 Followers 17 Following An account devoted to beautiful data visualizations. DM or @ for submissions. Run by @kmpanthagani. #dataviz
Elevate Dataviz Learn.. @DatavizElevate
559 Followers 60 Following Elevate Your Dataviz Skills with techniques, freelance & career advice and live group-coaching with @AlliTorban, @duncangeere, @Data_Soul and @W_R_Chase
GPS DataViz @GPSDataViz
501 Followers 645 Following Our software gives coaches automated insights from their performance data that keep players healthy and help them WIN MORE GAMES! #EmpowerYourData
Dataviz & AI @DataVizAI
3K Followers 309 Following Tweets about Cool stuff related to #DataViz #PixelArt #AI #MachineLearning & #DataScience
DataViz, Inc. @DataVizInc
2K Followers 2K Following Developer of the iOS, Android, Mac & Windows productivity apps including DailyBalance, Docs To Go and Passwords Plus.
Dataviz Belgium @DatavizBE
345 Followers 122 Following Twitter account of the Belgian Dataviz Community 📊📈

Surreal_dataviz @SurrealDataviz
225 Followers 132 Following Life is complicated and the universe is run by chaos, let’s celebrate them with beautiful nonsense #dataviz! 🎉🥳📊

Vancouver DataViz @VanDataViz
120 Followers 142 Following A group is for anyone interested in #dataviz #datavisualization #dashboards We love programmers, artists and data nerds! Located in beautiful #vancouver

datavizBot @datavizBot
69 Followers 44 Following Daily posting of random, not always meaningful datavisualizations.
CADA DataViz Wrkshp @cadadataviz
49 Followers 4 Following Data Visualization & Processing workshop @ CADA, April 20-22, 2009

FT Data @ftdata
52K Followers 52 Following Welcome to FT Data, where we share news graphics and data-driven stories from the @financialtimes. Run by the @FT Visual and Data Journalism team. #ddj #dataviz
Stephanie Evergreen @evergreendata
16K Followers 256 Following Writing & teaching about #dataviz. Get immediately useful advice in my biweekly newsletter. she/her
VOYD @voydorg
3K Followers 45 Following Veri Okuryazarlığı Derneği (VOYD) -Data Literacy Association(DLA) @voydorg_en #opendata #dataliteracy #ddj #datajournalism #dataviz https://t.co/gSTjR1GA7C
Açık Veri Gazetecil.. @DagmedyaVeri
4K Followers 62 Following @gijn üyesi Açık Veri Gazeteciliği PlatformuTR #verihaberciliği #verigörselleştirme #datajournalism #opendata #açıkveri #vg #ddj #dataviz hk.içerik üretir!📈![a curated guide to the best tools and resources for data visualization and interactive storytelling. [curated by @carlvlewis, seeking others!]](https://pbs.twimg.com/profile_images/797970304513540096/bbHxXaEf.jpg)
DataViz.Tools @dataviztools
409 Followers 135 Following a curated guide to the best tools and resources for data visualization and interactive storytelling. [curated by @carlvlewis, seeking others!]
Ozancan Özdemir @OzancanOzdemir
7K Followers 1K Following PhD Candidate at @BernoulliInsti2 | İstatistik-@METU_ODTU | Ankara & Groningen | ML 🤖 | #rstats | Yerel Yön., AÜ| Galatasaray | #dataviz | Tweets in TR/ENG
Shirley Wu @sxywu
33K Followers 736 Following chinese-american artist, software engineer, dataviz designer, keynote speaker, published author && a work-in-progress learning to take up space ✨
World Bank Data @worldbankdata
79K Followers 412 Following The Development Data Group unlocks the full value of #data for development. Follow us for #opendata news, stories & #dataviz. More: https://t.co/SYIZiT3mF6
Pacific Dataviz Chall.. @PacificDataviz
41 Followers 37 Following 🌏📊 Competition co-organised by the Pacific Community and the New Caledonian Government. Help us to breathe life into Pacific Data !
Neil Kaye @neilrkaye
18K Followers 348 Following Climate data scientist @metoffice specialising in generating interactive websites and bespoke #dataviz. #climate #maps #GIS #mapping #Rstats Views are my own
Ketan Deshpande @ketan_dataviz
194 Followers 158 Following
Evelyn Münster @dataviz_de
517 Followers 614 Following Datenvisualisierung. Datenprodukte. Designing with Data. Newsletter: https://t.co/QdWRoPE9Cc
Antti Lipponen / @ant.. @anttilip
15K Followers 1K Following Physicist, research scientist at Finnish Meteorological Institute (@IlmaTiede). #Satellites, #aerosols, #climate, #remotesensing, #dataviz + #bike/#fatbike 🚲
DatavizRio @DatavizRio
862 Followers 207 Following Projeto de divulgação e ensino em #dataviz pelas lentes do Design. Promovemos meetups, palestras, oficinas e cursos. Por @juliagiannella e @amorim_1979
Sam Lillo @splillo
14K Followers 889 Following Senior software engineer @DTNweather • Ph.D. @UofOklahoma • NWP across scales • Tropical Cyclones • S2S • Dataviz • Python • Tweets are my own
Lisa Charlotte Muth @lisacmuth
35K Followers 729 Following Formerly @lisacrost. Creating & writing about dataviz for @datawrapper. #visber & @datavisclub organizer. Also over there: @[email protected]
Ibrahim Tanyalcin @ibrhmTanyalcin
2K Followers 161 Following Software engineer,Geneticist, admin @MutaFrame,JS,Dataviz, https://t.co/3sUQEkSF6y… Views are my own. 62 69 74 63 6f 69 6e
zkn360 @zkn360_dataviz
457 Followers 124 Following #Tableau の中の人でした。Tableau/データ可視化の良い点、小技、アイデアを記録目的でツイートします。Tableau を普遍的なスキルにすることが目標。
Mustafa Çavuş @mustafa__cavus
2K Followers 896 Following Asst. Prof. of Applied Stat @esteknikuniv • Researcher @mi2_ai • PhD in Applied Statistics • Interested in #eXplainableAI #DataViz #rstats
Ryan Colliver @ryan_dataviz
289 Followers 493 Following Sr. Mgr., Prod Marketing & MICI @Lexmark. Husband & Daddy. Data Junkie. My views.
EDAV @ElectionDataviz
224 Followers 150 Following Elections Data Analytics & Visualization (EDAV) #Election2015 by @Orodata / Explaining election data using infographics and visualizations.
vr_dataviz @vr_dataviz
40 Followers 156 Following Let's discuss #VR and #data together! Every few weeks, we collect #info from different organisations & visualise. All things #immersive, #data & #visualisation.
Fatma Çınar @fatma_cinar_ftm
2K Followers 535 Following Areas of Interest #DataManagement #Rstats #OR #GraphicalDatamining #DataViz #PractitionerProbabilist #ML #Finance #RiskManagement #Complexity #Chaos @DataLabTR
datavizOttawa @datavizOttawa
99 Followers 75 Following We're a group that meets regularly to discuss data visualization, data communication, infographics, exploratory data analysis,perceptual psychology, and more!
PDX Dataviz @PDXdataviz
168 Followers 40 Following
Topicly DataViz @topiclydataviz
544 Followers 2K Following AI and ML bringing you the best data viz news.
LaurentMT @LaurentMT
9K Followers 628 Following #FreeSamourai//bitcoin, privacy, data analysis&dataviz//PGP: 0x74D301663DF993B8D1C68B50A059A03E81CF61C9//"Idiot, outright dishonest and extremely incompetent"
USGS Data Science @USGS_DataSci
11K Followers 185 Following Featuring @USGS #dataScience and #DataViz
Dr. Dominic Royé @dr_xeo
15K Followers 2K Following -Understanding the World- Dr. in Physical Geography | Climate - Environmental Health. Researcher from 🇩🇪 at @FIClima 🦋https://t.co/FryUgBHKnJ #rstats #dataviz

📈 DataViz.vg 🌱 @datavizvg
80 Followers 151 Following Dataviz for the Veg Community. Also sharing news about the plant-based movement.
Dataviz Consultant @adhibaguspribdi
196 Followers 260 Following Konsultan, Trainer & Desainer Visualisasi Data| Hand's On Tableau Henry Harvin Analytics Academy | CP: 0857 0713 2649

Lyon Dataviz @lyondataviz
292 Followers 282 Following La #dataviz sur Lyon. Prochains meetups sur https://t.co/yYu0ibTTzH par @romsson @aurelient @clemsos et @MAKIO135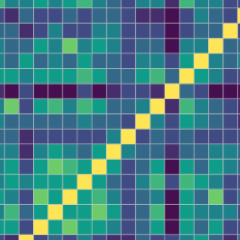
aRt of dataviz @aRtofdataviz
256 Followers 520 Following I do R #rstats #dataviz #dh #compsocsci workshops. Feel free to invite me to come teach you cool stuff! Also occasional dataviz & R tweets. By: @AndresKarjus
DataViz Answers @DataVizAnswers
156 Followers 214 Following Tips and Tricks to make your data visualization successful. Ask good questions. Analyze all your data. Make your data beautiful!
OxShef @oxshef_dataviz
44 Followers 29 Following A collaboration between University of Oxford and University of Sheffield to promote a reproducible #dataviz workflow
Sharelock-Dataviz @SharelockDatavz
110 Followers 200 Following We are a design and data visualization research group of Density Design Lab at Politecnico di Milano
dataviz.nl @dataviznl
58 Followers 67 Following Its timeline will be logged for usage in the dataviz lessons offered at CMD @ HvA. My feed is at http://t.co/VBwua5a0
Sadettin Demirel @demirelsadettin
653 Followers 548 Following Dr. Öğretim Üyesi @uskudaruni | PhD @istanbuledutr | MS @goteborguni | BS @khasedutr | Co-founder @voydorg #rstats, #textmining #ddj #dataviz
Emil O W Kirkegaard @KirkegaardEmil
29K Followers 886 Following #psychology #genomics #hbd #rstats #statistics #transhumanism #dataviz #openscience #psychometrics @OpenPsychJour

DataViz @DataVizz
53 Followers 90 Following DataViz is a compilation of interesting data visualization and tools from the web.
ZACH @ZachBowders
8K Followers 659 Following Data + Love Podcast | Tableau Visionary & Ambassador | Dataviz Maverick
DataViz.my @datavizmy
70 Followers 245 Following We are your data education. Our mission is to promote a culture of active learning around data. 🤝 Let's collaborate, DMs open to connect.

Natasha @dataviz_Tasha
74 Followers 109 Following
Joshua Stevens @jscarto
15K Followers 1K Following Cartographic Editor @mapsdotcom & Content Strategy @Esri. Prev: DataViz Lead @NASAEarth, @NSF PhD Fellow @PSUGeography. Dad stuff everywhere else. Views my own.
Jon Schwabish @jschwabish
24K Followers 995 Following 📈Economist & DataViz 🕸@urbaninstitute @PolicyViz 🎙PolicyViz Podcast 📺YouTube step-by-step tutorials 🗞On Substack: https://jschwabish.subst 👀All views mine
Ramon Suarez 🇪🇺.. @ramonsuarez
7K Followers 245 Following Energetic, driven, imaginative and proactive problem solver into data analysis, business analytics, dataviz, value based marketing, pkm, learning and sharing.
dataviz-factory @dataviz_factory
24 Followers 101 Following Créateur de dataviz, d'API, de bots pour data driven journalism. dev #d3js #javascript #node #bigdata http://t.co/4WtwHfkoTH
dataviz_sp bot @dataviz_sp
200 Followers 782 Following Visualização de dados sobre covid do estado de São Paulo. #dataviz #covid Responsável: Raphael Silva, cientista de dados (https://t.co/MuoLWFv6mF…)
Econ_DataViz @Econ_DataViz
134 Followers 1K Following Visualising : Economics and Education focused, among other things.
竜 SM₳UG @SmaugPool
11K Followers 1K Following Desinfluencer. Mostly blockchain software, dataviz, memes & gifs 🟣🔴https://t.co/AfZSwMmdjn 🌐https://t.co/Fp8ftE4mkQ 🌍SMAUG stakepool #Cardano #Bitcoin
Qiusheng Wu @giswqs
38K Followers 5K Following Associate Professor @UTKGeography | @Amazon Visiting Academic | Senior Reseach Fellow @UNUINWEH | #EarthEngine GDE | Talk about #opensource #geospatial #dataviz
Highcharts @Highcharts
6K Followers 165 Following World's most popular interactive #JavaScript chart library. Get support: https://t.co/XqC5DQxO2C #charts #dataviz
Philipp Koytek @p4dataviz
85 Followers 172 Following ▪️◾️◼️⬛️ Data Visualization: Enthusiast | Designer | Engineer ⬛️◼️◾️▪️
The DataViz @The_DataViz
7 Followers 0 Following Medium Blog Focused on Data Visualizations, Analysis and Data Storytelling
DataViz Club @datavizclub
12 Followers 9 Following Welcome to the DataViz Club! 📊 Sharing examples of great dataviz Instagram: datavizclubIgor Cotruta @igocrite
1K Followers 671 Following Business Intelligence developer. Tweeting about #PowerBI and #DataViz

Stjsmith_dataviz @SDataviz
0 Followers 15 Following
Michael Watkins 🇺�.. @watkinstrack
2K Followers 285 Following Lead Data Scientist at TelevisaUnivision. I like Google BigQuery, Knime, DataViz, Python/hurricane science. My opinions do not represent my employer.